Displays
Contains help information relating to Emtron display products.
Contains help information relating to Emtron display products.
Display Studio is available via EmUpdater.
Loading release notes…
Download and install Display Studio via EmUpdater. See the Display Studio guide for a full walkthrough of the application.
Explains the fundamental concepts of channels and events.
This page outlines the core concepts of channels and events, which are essential for data communication within the system.
Channels represent a single piece of dynamic data, serving as the primary communication method within the system. They facilitate data transmission between inputs, functions, and outputs, holding either numerical values or text strings. Channels are ideal for representing sensor readings, user inputs, intermediate values, or other dynamic data that requires processing or display.
The system includes a wide range of built-in channels for common use cases. Using these predefined channels is recommended, as they ensure compatibility across Emtron displays, enabling seamless mapping during configuration imports. If no suitable built-in channel exists, custom channels can be created.
Examples: Engine Speed, Manifold Pressure and Engine Temperature
Custom channels allow you to define named channels tailored to specific use cases. However, when importing or exporting sub-configurations with custom channels, compatibility issues may arise with other base configurations. Reconfiguring or remapping channels is often necessary in such cases.
TIP: If a commonly used channel is missing from the predefined list, contact Emtron support to request its addition.
Channels use predefined metric units wherever applicable. The system operates internally in metric units.
The channel preference system allows you to change display units (e.g., from meters to feet) at the point of display. The system automatically handles conversions between compatible units of the same type.
Events signal specific occurrences within the system, enabling different components to communicate and respond to changes. Unlike channels, which represent continuous data, events are discrete and occur at a specific point in time.
Examples Engine Start, Lap Beacon and Keypad Press 1
Custom events can be created the same as custom channels
The channel and event system enables communication between various system functions without requiring direct knowledge of each other. This design offers maximum flexibility, allowing functions to interact in any desired configuration.
However, be mindful of the following:
The flexibility provided by this system outweighs these potential drawbacks for a highly configurable product.
Inputs receive channel values or events. For example, a gauge on a display can be an input that reflects a channel’s value. Channels and events can be mapped to configurable inputs across various system functions, and a single channel or event can be mapped to multiple input functions as needed.
Outputs write data to channels or events. Key distinctions between channels and events as outputs include:
Functions can be chained together to perform more complex processing tasks.
It is important a unique channel is used between each function.
graph LR;
  A[Example Input] -- Channel Value A --> B(Math Function)
  B -- Scaled Value A --> C(Table Function)
  C -- Scaled Value B --> D(Table Function)
  D -- Scaled Value C --> E(Example Output)
Note: Each level of chaining can add between 0 and 10ms of processing delay.
The following are contrived examples to demonstrate what is possible.
This uses the math function to average two channels before spitting them out on the CAN bus.
graph LR;
  A[Frequency Input 1] -- Wheel Speed Left Rear --> C(Math Function)
  B[Frequency Input 2] -- Wheel Speed Right Rear --> C
  C -- Wheel Speed Average Rear --> D(CAN0 Tx)
Note: As channels can be assigned to multiple inputs,
Wheel Speed Right Rearcould also be assigned to a gauge on the display, or recorded by the data logging system.
Unlikely in real life, but demonstrates combining data from different sources, using a table to scale, then outputting the result.
This uses the table function to combine the potentiometer and engine temperature to select a shift point which is fed into the shift pattern.
graph LR;
  A[CAN0 Rx] -- Engine Speed --> C(Table Function)
  A[CAN0 Rx] -- Engine Temperature --> C(Table Function)
  B[Analog Input] -- Shift Adjust --> C(Table Function)
  C(Table Function) -- Shift Level --> D(Shift Light)
By default the shift system uses a gear based calculation. This steps around this and uses a table to combine engine temperature and a user setting.
Introduction The Emtron telemetry system provides high speed, fully wireless telemetry services. Telemetry can connect over a 4G wireless modem or a Starlink satellite modem. Telemetry products can be purchased from the Emtron website. Data Service Remote monitoring of channel and event data.
Real-time cloud-based data streaming platform enabling vehicles to broadcast live sensor and performance data to authorized users
Real-time audio communication feature allowing users to conduct voice calls with automatic speaker management, push-to-talk control, and priority-based communication
Real-time messaging feature for communicating with other users connected to the same vehicle or session, with automatic alerts, text commands and message history
Configure on-board data logging on the display.
Measure elapsed time and speed at drag strip distance markers.
Event- and condition-driven counters with wrap, follow, reset, and force.
Track total distance and trip meters.
Retain channel values across power cycles.
Configurable start, stop, and reset logic for time-based channels.
Configure CANopen on a CAN bus: network control, nodes, PDOs, channel packing, and diagnostics
Single-segment stage, rally, or hill-climb timing (arm → start → finish).
Saved circuit, drag, and stage runs — reference for live deltas and review on gauges.
Alarms Alarms monitor the system at runtime and notify the operator when something requires attention. Each alarm evaluates a set of trigger conditions every update cycle and, when active, broadcasts its message through dedicated system channels. Alarm List and Priority Alarms are processed in list order — position 1 is the highest priority, position 2 is lower, and so on. When multiple alarms are active simultaneously, only the highest-priority active alarm (lowest list index) is shown on the alarm channels at any given time.
Produces Channels and/or Events based on programmable conditions. The Logic Output Channel is the channel that will be produced when the condition is met. It’s value will be 1 when true, 0 when false. The On Logic True Output Event is produced when the condition becomes true. The On Logic False Output Event is produced when the condition becomes false. The Logic On Delay is the time in milliseconds that the logic output will be delayed after the condition is met. The Logic Off Delay is the time in milliseconds that the logic output will be delayed after the condition is no longer met.
Condition Setup Conditions are the trigger logic used throughout the system — in alarms, virtual inputs, conditional logic, and more. A condition set is a list of one or more individual conditions combined with logic operators. Individual Conditions Each condition compares a channel value against a threshold and returns true or false.
Comprehensive reference for all gauge types in the Emtron Displays
Emtron ED Series Displays contain 6 axis Inertial Measurement Unit (IMU). Output Channels G-Force Lateral G-Force Longitude G-Force Vertical Acceleration Lateral Acceleration Longitude Acceleration Vertical Angular Velocity X Angular Velocity Y Angular Velocity Z Roll Pitch Yaw Calibration
The Lap Timing function outputs lap and timing data based triggered by lap beacon events. Input Channels Speed Channel: Select the channel to use as the speed input. Lap Distance Channel: Optional - Select the channel to use as the lap distance input. Note: Lap and Race distance can be calculated from the speed input channel.
How to configure the LIN Bus
How to configure the real time math processing system
User guide for configuring and using the OBD2 scanner module
This guide explains how to configure and manage PID (Proportional-Integral-Derivative) controllers for process control. The guide covers how to set up controllers, assign channels, define conditions, adjust limits, configure gain tables, and monitor diagnostics for effective PID control. Overview A PID controller adjusts a process by calculating an error (difference between a desired set point and the measured process variable) and applying proportional P, integral I, and derivative D corrections to produce an output. This software allows you to configure multiple PID controllers, each with customizable channels, conditions, limits, and gain tables. Real-time diagnostic plots help monitor and tune controller performance.
How to configure the shift lights on the device
Speed Fusion Overview Speed Fusion combines data from multiple sensors to produce a single, accurate speed measurement that is more reliable than any individual source. It draws on GPS speed, drive speed (from the ECU or CAN bus), wheel speed sensors, and IMU data (accelerometer and gyroscope) to deliver a smooth, low-latency fused speed output.
How to configure the switching input logic on the device
How to add and configure two dimensional tables
Track Setup determines how GPS based Lap Timing functions. Lap Timing and Track Setup are separated so that other systems can also generate the lap and sector beacons. This allows the use of other timing systems such as laser beacons. Location Detection
Default Network By default the ED Series Displays will broadcast the following Wi-Fi networks. Model SSID Passphrase ED10M ED10M ed10mwifi ED7M ED7M ed7mwifi ED7 ED7 ed7_wifi Settings The user can change the SSID and Passphrase freely. Note: This change is stored in the device, independent of the loaded config.
The Emtron telemetry system provides high speed, fully wireless telemetry services. Telemetry can connect over a 4G wireless modem or a Starlink satellite modem.
Telemetry products can be purchased from the Emtron website.
Remote monitoring of channel and event data.
Voice Communications (Voice Comms) is a real-time audio communication feature that allows you to talk with other users connected to the same vehicle. Whether you’re coordinating between multiple operators, communicating with remote technicians, or managing a team during testing, voice comms provides clear, direct communication with built-in priority management.
Text Communications is a real-time messaging feature that lets you communicate with other users who are connected to the same vehicle or session. Whether you’re using the desktop application or accessing the web interface, you can send and receive messages instantly.
To activate the Telemetry feature on your device, login to EmNet.
Once logged in, from your Dashboard, click the Activate Telemetry button.
Once the details have been filled out, click Activate Now to complete the process.
| Product | Data | Text | Voice |
|---|---|---|---|
| ED7 | ✅ | ✅ | ❌ |
| ED7M | ✅ | ✅ | ✅ |
| ED10M | ✅ | ✅ | ✅ |
In Display Studio, the first thing to configure is the authentication settings, found in File → Telemetry Credentials.
| Setting | Description |
|---|---|
| Region | Select the region closest to you for lower latency |
| Vehicle Name | Exact vehicle name entered during the activation step above |
| Password | The same password entered during the activation step above |
| Use SSL | Must be set to true when using official Emtron servers |
| Validate SSL Certificate | Optional: Verifies server authenticity. |
If the device is wired without a battery backup, it will lose its system clock on every power cycle. An incorrect system time will cause SSL certificate validation to fail, and the device will be unable to connect to the telemetry server.
To avoid this, either:
Ensure to click Save Telemetry Settings as these are stored independently of the config.
On the PC, use EmStream to subscribe to the live telemetry stream, monitor channels, and use voice and text chat. See the Getting Started guide for connection steps.
The following diagram shows the relationships between systems for a telemetry data connection via a RUTM11 4G modem.
erDiagram
"License Server" ||..|| "Telemetry Server": "validates credentials"
"Telemetry Server" ||..o{ "Telemetry Modem (RUTM11)" : "4G internet"
"Telemetry Modem (RUTM11)" ||--|| "Emtron Display (ED10/ED7)" : "PUB: telemetry data"
"Telemetry Server" ||..o{ "Standard Modem" : "internet"
"Standard Modem" ||--o{ "PC with EmStream" : "SUB: telemetry data"

"PC with EmStream" {
    display-name required-text-chat
    vehicle-name REQUIRED
    password REQUIRED
    region REQUIRED
}

"Emtron Display (ED10/ED7)" {
    serial-number built-in
    display-name optional
    vehicle-name REQUIRED
    password REQUIRED
    region REQUIRED
}
Telemetry Provider is the standard operating mode for most applications and is the subject of this help topic.
Telemetry Consumer is for advanced usage and should be DISABLED for a standard telemetry setup.
Assuming you have an active telemetry license and the authentication settings configured in Display Studio, you can now configure the telemetry function.
Telemetry data settings can be accessed from the main menu: Functions → Telemetry. Ensure the Telemetry Provider tab is selected.
| Setting | Description |
|---|---|
| Enable | Globally activate/deactivate telemetry streaming |
| Data Mode | Always set to compressed |
| Active When | When the conditions are met, data will begin streaming. e.g. RPM > 300 |
| Slow Tx Rate | Transmission Rate of the slow data set |
| Fast Tx Rate | Transmission Rate of the fast data set |
| Transmit Events | Enable to send all system events over telemetry |
| Channel Configuration | Allocate channels you want to be sent in the appropriate group |
Best practice: Only include channels you actually monitor. Unnecessary channels waste bandwidth.
Once configured, ‘Write’ the config.
| Function | Description |
|---|---|
| Export Telemetry Config | Exports (excluding authentication) telemetry settings to a file |
| Import Telemetry Config | Imports (excluding authentication) telemetry settings from a file |
The following channels are available to monitor the status of the system.
| Channel | Description |
|---|---|
| Telemetry Provider Status | The connection status to the telemetry server |
| Telemetry Provider Error | The reason for connection failure on error |
| Telemetry Provider Raw Tx Bandwidth | The current uncompressed bandwidth being transmitted |
| Telemetry Provider Compressed Tx Bandwidth | The current compressed bandwidth being transmitted |
| Telemetry Provider Compression Ratio | The ratio of compressed to decompressed data |
Important: The connection status is the status of connection to the telemetry server. It doesn’t know if EmStream is receiving data.
EmStream stores authentication information per service type rather than in one place for flexibility.
The data service settings can be found in File → Connection Settings.
| Setting | Description |
|---|---|
| Host | Enter the host from the below table based on the region configured in the device |
| Vehicle Name | Exact vehicle name entered during the activation step above |
| Password | The same password entered during the activation step above |
| Use SSL | Must be set to true when using official Emtron servers |
| Region | Host |
|---|---|
| Australia | telemetry-aus.emtronaustralia.com.au |
| North America | telemetry-usa.emtronaustralia.com.au |
Once entered, select Connect to connect to the telemetry server. If an Emtron Display is also connected you should start seeing channel data on the
right hand side panel showing with Telemetry Connected in the top right hand corner.
If connection fails, the reason will be shown in the Connection Settings popup.
Assuming you have an active voice license and the authentication settings configured in Display Studio, you can now configure the voice comms function.
Voice chat settings can be accessed from the main menu: Functions → Voice Comms.
| Setting | Description |
|---|---|
| Enable | Globally activate/deactivate voice communications |
| Broadcast Priority | Speaking priority when there are multiple users. (0 = highest priority, 10 = lowest) |
| Push to Talk Condition | When the conditions are met, voice will be transmitted. |
Once configured, ‘Write’ the config.
| Function | Description |
|---|---|
| Push to Talk On | Forces push to talk on |
| Push to Talk Off | Forces push to talk off |
| Push to Talk Toggle | Toggles the push to talk state |
The following events can be triggered in the system to control the push to talk feature (the above function buttons emit these events).
| Event | Action |
|---|---|
| Push to Talk On | Forces push to talk on |
| Push to Talk Off | Forces push to talk off |
| Push to Talk Toggle | Toggles the push to talk state |
The following channels are available to monitor the status of the system.
| Channel | Description |
|---|---|
| Voice Connection Status | The connection status to the voice server |
| Voice Connection Error | The reason for connection failure on error |
| Voice Tx State | Shows either: Silent or Speaking |
| Voice Rx State | Shows either: Silent or Speaking |
Important: The connection status is the status of connection to the voice server. It doesn’t know if EmStream is also connected.
EmStream stores authentication information per service type rather than in one place for flexibility.
The data service settings can be found in File → Voice Settings.
| Setting | Description |
|---|---|
| Host | Enter the host from the below table based on the region configured in the device |
| Vehicle Name | Exact vehicle name entered during the activation step above |
| Password | The same password entered during the activation step above |
| Use SSL | Must be set to true when using official Emtron servers |
| Priority | Your speaking priority when there are multiple users. (0 = highest priority, 10 = lowest). |
| Enable Push-to-Talk | If enabled, your voice will only be transmitted when the bound button is held down. |
| PTT Key | The configured push to talk key, click rebind to change this. |
| Enable Audio Playback | Uncheck this only if you want to be able to transmit, but not hear anything from others. |
| Region | Host |
|---|---|
| Australia | voice-aus.emtronaustralia.com.au |
| North America | voice-usa.emtronaustralia.com.au |
Once entered, select Connect to connect to the voice server. Once connected you will see Voice Connected in the top right hand corner.
If connection fails, the reason will be shown in the Voice Settings popup.
If push to talk is active, your voice will be transmitted only when the bound key is held down.
If push to talk is inactive, EmStream will attempt to detect your voice and transmit it when you are speaking. Silence will not be transmitted.
The voice server manages multiple speakers using a priority system:
Scenario 1: Small team (1-2 people)
Scenario 2: Three or more people connected (3+ people)
Use Case Guidelines:
| Priority | Person | Best For |
|---|---|---|
| 0-1 | Driver, Race Engineer | Must speak first; critical communications |
| 3-5 | Regular technician, Supervisor | Normal priority |
| 6-8 | Support staff, Assistant | Lower priority |
| 9-10 | Observers, Remote listeners | Minimal speaking |
Assuming you have an active text chat license and the authentication settings configured in Display Studio, you can now configure the text chat function.
Text chat settings can be accessed from the main menu: Functions → Text Chat.
| Setting | Description |
|---|---|
| Enable Text Communications | Globally activate/deactivate text communications |
| Display Name | Enter a name for your session in the chat. e.g. John. Must be unique per vehicle |
| Quick Messages | Quick Messages |
| Message Triggers | Message Triggers |
Once configured, ‘Write’ the config.
The following channels are available to monitor the status of the system.
| Channel | Description |
|---|---|
| Text Connection Status | The connection status to the text chat server |
| Text Error | The reason for connection failure on error |
| Text Last Message 1-8 | A history of messages received (1 most recent) |
| Text Last Sender 1-8 | A history of message senders (1 most recent) |
Important: The connection status is the status of connection to the text chat server. It doesn’t know if others are connected.
The following events are generated by the chat system.
| Event | When |
|---|---|
| Text Message Received | A text message is received |
| Text Message Sent | A text message is sent |
EmStream stores authentication information per service type rather than in one place for flexibility.
The data service settings can be found in File → Text Chat Settings.
| Setting | Description |
|---|---|
| Host | Enter the host from the below table based on the region configured in the device |
| Display Name | Enter a name for your session in the chat. e.g. John. Must be unique per vehicle |
| Vehicle Name | Exact vehicle name entered during the activation step above |
| Password | The same password entered during the activation step above |
| Use SSL | Must be set to true when using official Emtron servers |
| Region | Host |
|---|---|
| Australia | text-aus.emtronaustralia.com.au |
| North America | text-usa.emtronaustralia.com.au |
Once entered, select Connect to connect to the text server. Once connected you will see Chat Connected in the top right hand corner.
If connection fails, the reason will be shown in the Text Chat Settings popup.
Once connected, you can open the *Chat Console by either clicking the icon in the top right hand corner or from the menu View → Show Chat Console.
Open the chat page in your browser, depending on your region:
| Setting | URL |
|---|---|
| Australia | https://text-aus.emtronaustralia.com.au/chat |
| North America | https://text-usa.emtronaustralia.com.au/chat |
Log in with your credentials
| Setting | Description |
|---|---|
| Your Display Name | Enter a name for your session in the chat. e.g. ‘John’. Must be unique per vehicle |
| Telemetry Vehicle Name | Exact vehicle name entered during the activation step above |
| Telemetry Password | The same password entered during the activation step above |
Once logged in, the chat window opens automatically.
You can send messages to the chat room based on events occurring.
| Setting | Description |
|---|---|
| Event | When this event occurs, the message will be sent |
| Message | The text at the start of the automated messages. |
| Append Channel Value | The a channel’s value to append to the messages when sending. |
e.g. Set event to Engine Start, message to Engine Started, fuel level, and append channel to Fuel Level.
When the vehicle starts, all connected chat clients will see a message saying the engine has started with the current fuel level.
You can respond to certain patterns being received. When they are received you can publish a system event.
| Setting | Description |
|---|---|
| Pattern | The pattern you want, e.g. “#next-screen”. |
| Trigger Event | The event you want to publish in the system. e.g. “Next Screen” |
With the above examples, you could change the screen on the Emtron display by sending #next-screen in a connected chat client.
Functions → Logging
The logging function records channel values and events to files on the display’s internal storage. Logged data can be downloaded from the Home view when a device is connected.
Logging is organised into groups. Each group defines what to log, when to start, and when to stop.
Groups can be exported and imported as .lgrp files to share logging setups between configs.
Each group has four main areas:
Define when logging begins. Use condition sets to trigger on channel values, events, or combinations — for example, when engine RPM exceeds idle speed.
Define when logging ends. Common choices include ignition off, a manual stop event, or a timer expiry.
Add channels to record and set each channel’s Log Rate. Higher rates capture more detail but produce larger files.
Add events to record. Event timestamps are stored when the event fires.
The Settings tab configures global logging parameters such as file naming, storage limits, and post-trigger behaviour. Adjust these to match how much storage the display has available and how long you need logs retained.
Functions → Drag Race Timing
Drag Race Timing measures elapsed time and speed from a standing start, recording results at standard drag strip distance markers. Distance is calculated by integrating the configured speed channel.
Check Enable to activate the function.
| Setting | Description |
|---|---|
| Speed Channel | Source speed in km/h — required for distance integration |
| Arm Conditions | Conditions that must become true before a run can start |
| Start Conditions | Conditions that trigger the run start on a rising edge |
| Abort Threshold | Run is aborted if speed drops below this value (km/h) |
When a run is active, the function records time and speed at each marker:
| Marker | Distance |
|---|---|
| 0–60 ft | Start line |
| 60 ft | 18.3 m |
| 330 ft | 100.6 m |
| 1/8 Mile (660 ft) | 201.2 m |
| 1000 ft | 304.8 m |
| 1/4 Mile (1320 ft) | 402.3 m |
The run completes automatically when the 1/4 mile distance is reached, or aborts if speed falls below the abort threshold.
The function writes elapsed time and trap speed at each marker, plus cumulative Drag Time and Drag Distance channels during a run. A live drag time slip preview is shown on the configuration page when a device is connected.
Map the drag timing output channels to Value or Time gauges on a screen. For example, show 1/4 Mile Time and 1/4 Mile Speed on a dedicated drag page.
Drag timing can also work alongside Lap Timing — use a finish beacon on a drag strip start/finish line for point-to-point events.
Functions → Counters
Counters hold a numeric value that changes when events fire or conditions become true. Typical uses include counting gear shifts, button presses, or how many times a threshold was crossed.
Each counter can increase or decrease based on:
Step (increment / decrement amount) controls how much the value changes each time.
When Wrap is enabled, the counter wraps to the minimum when it exceeds the maximum (and the reverse when decreasing). When wrap is off, the value clamps at the limits if clamp options are used.
A counter can follow another channel: it tracks the increments and decrements of that channel rather than copying its absolute value. Use a follow condition when the follow behaviour should only apply in certain states.
Reset the counter to a fixed value or to the value of another channel when an event or condition becomes true.
While a forced condition is true, the counter is held at a forced value. When the condition clears, the counter returns to its previous value.
If Persistent is enabled, the counter value is stored on power off and restored on power up. The initial value is only used the first time, before any value has been stored.
See also Persistent Channels for retaining arbitrary channels across power cycles.
Functions → Odometer
The odometer function integrates a speed input to track total vehicle distance and up to four independent trip meters.
| Setting | Description |
|---|---|
| Speed Input (km/h) | Channel providing vehicle speed in km/h |
| Trip 1–4 Reset Event | Event that resets each trip meter to zero |
The main Odometer channel holds total distance in km. Trip channels hold distance since their last reset event.
The total odometer value can only be decreased with a one-time code from Emtron support:
Increasing the odometer (for example, after an instrument cluster replacement) does not require a support code.
Functions → Persistent Channels
Persistent channels save their values to non-volatile storage on the display. Values are restored when the device powers on, surviving power loss and config reloads.
Both numeric and string channels are supported.
Note: Only one function should write to a given channel. Do not configure the same channel as both a persistent channel and an active output from another function.
Functions → Timers
Timers produce a time value (seconds) on an output channel with configurable start, stop, and reset logic.
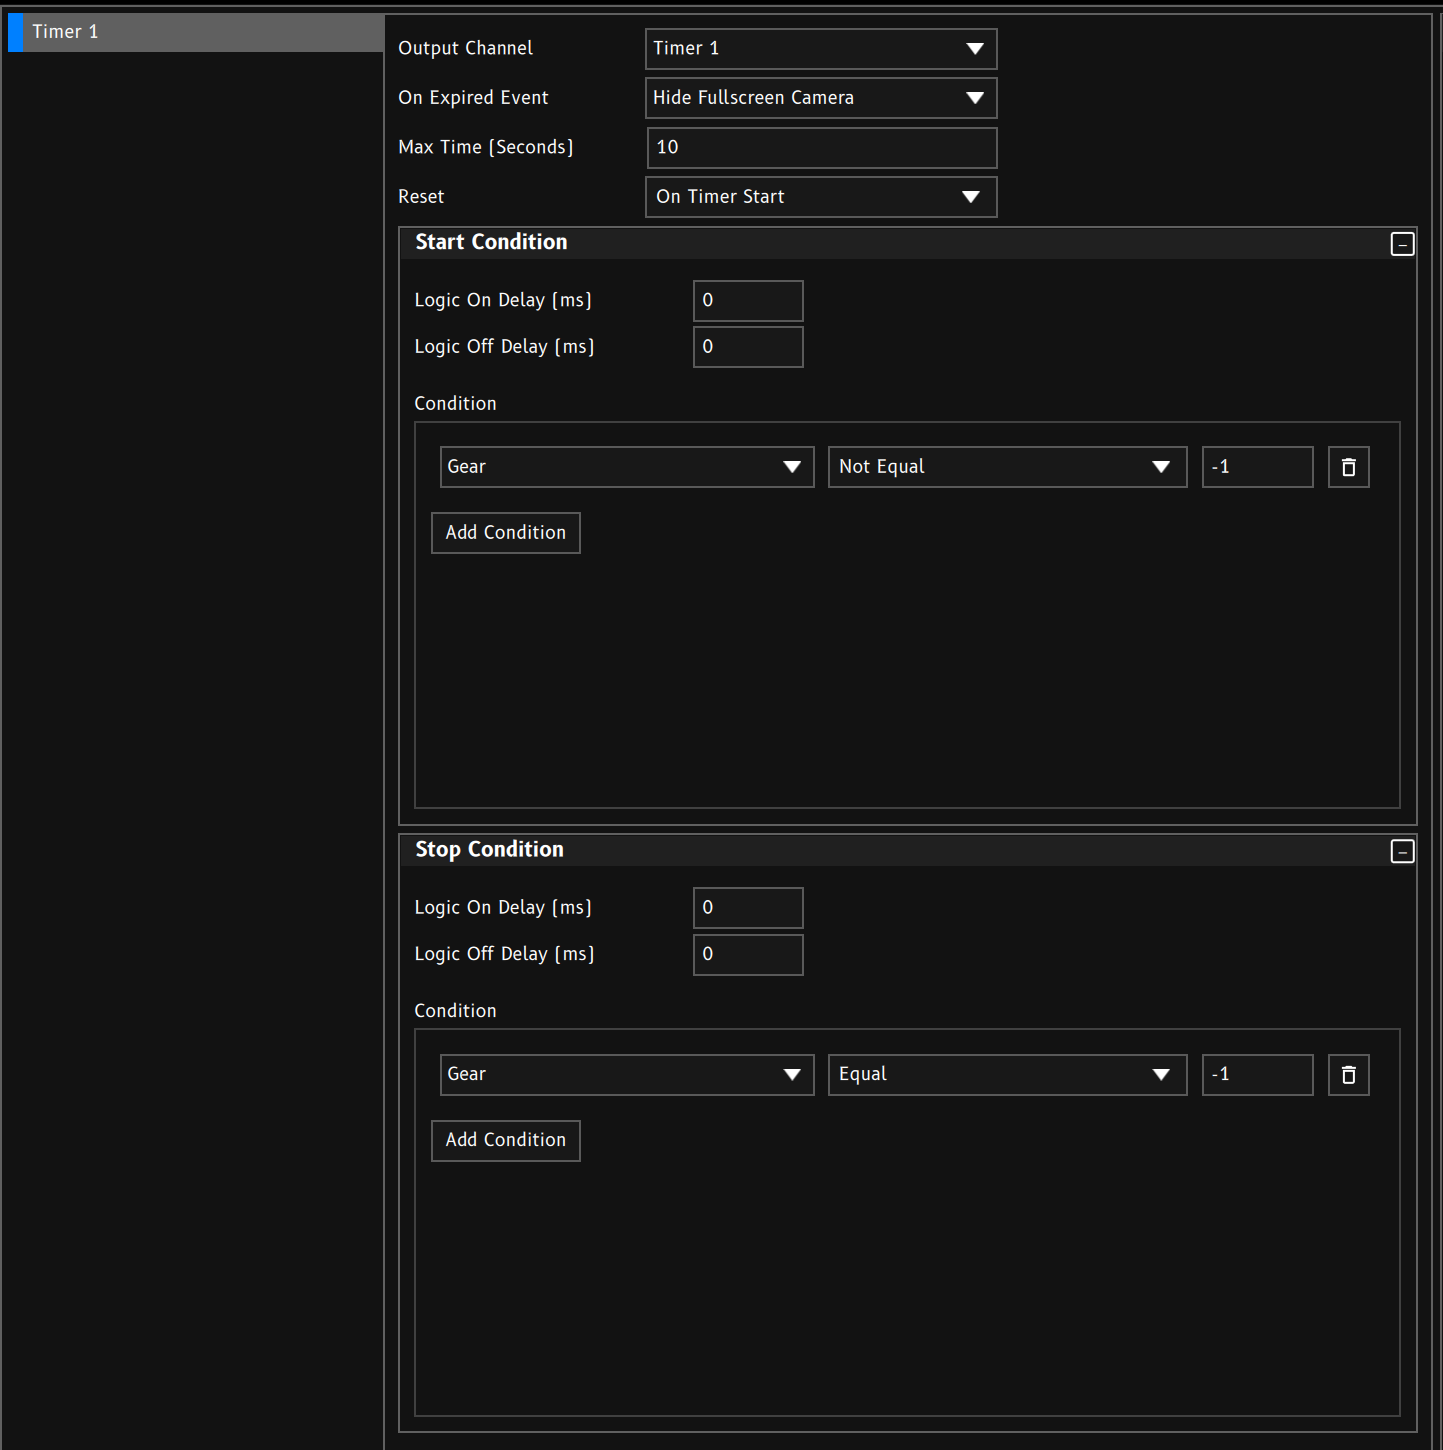
Example: hide the camera view 10 seconds after reverse gear is deselected.
Channel that holds the running time in seconds.
Event triggered when the timer reaches Max Time.
Maximum time in seconds. 0 = no time limit.
| Mode | Behaviour |
|---|---|
| Never | Timer never auto-resets |
| On Timer Start | Time resets to 0 when the timer starts |
| On Timer Stop | Time resets to 0 when the timer stops |
| On Condition | Time resets to 0 when the Reset Condition is true |
When the start condition is true and the stop condition is false, the timer runs. The stop condition takes precedence.
When true, the timer stops. If no stop conditions are set, the result is always false (does not force a stop by itself).
When true, the timer resets to 0. Only used when Reset Mode is On Condition. If no reset conditions are set, the result is always false.
CANopen is an industrial fieldbus protocol that runs on a standard CAN network. Use it when you need to exchange cyclic process data with drives, I/O modules, sensors, or other CANopen devices — for example fan controllers, valve drivers, or third-party modules that speak CANopen PDOs rather than a custom CAN message list.
For each CAN bus you can:
.canopen file.CANopen here is a master-oriented process-data bridge: NMT start, cyclic/event/sync PDOs, optional heartbeat and SYNC, and SDO support in firmware for advanced use. It is not a full device object dictionary editor or EDS importer.
These appear under the CANOpen heading on the bus Settings tab (alongside name, bit rate, and termination).
| Setting | What it does |
|---|---|
| Enable | Turns the CANopen stack on for this bus. When off, no CANopen frames are sent or decoded on that bus. |
| Act as Network Manager | When on, the device acts as an NMT master and sends Start Remote Node to each enabled CANopen node after configuration is applied (and again if a heartbeat consumer times out). When off, nodes are assumed already operational (another master on the bus). |
| SYNC Producer | When on (and a SYNC interval is set), the device periodically sends a SYNC frame (CAN ID 0x080). Use this when devices expect synchronous PDOs. |
| SYNC Interval (ms) | Period between SYNC frames. 0 = do not produce SYNC (even if SYNC Producer is checked). Typical values: 10–100 ms. |
| HB Producer (ms) | If non-zero, the device produces its own heartbeat at this period (milliseconds). 0 = off. |
| HB Producer Node ID | Node address (1–127) used for the heartbeat COB-ID (0x700 + node ID). Must be a free address on the bus. 0 = invalid / off. |
CANopen uses the same CAN bus settings as other traffic:
With CANopen enabled, the CANOpen tab configures nodes and PDOs for that bus.
At the top of the tab:
| Button | Action |
|---|---|
| Export | Saves this bus’s full CANopen configuration to a .canopen file (enable flags, SYNC/HB, all nodes and PDOs). |
| Import | Loads a .canopen file into this bus, replacing the current CANopen settings for that bus only. Other CAN buses and non-CANopen settings are unchanged. |
A node is one CANopen device on the bus, identified by its node address (node-ID).
Node 3 [On].| Setting | What it does |
|---|---|
| Enabled | When off, this node is ignored (no NMT start, no TX/RX PDOs for it). |
| Address (1–127) | CANopen node-ID. Must be unique on the bus and match the device (often set by DIP switches or software). Address 0 is not used for devices (reserved for NMT broadcast). |
| Default TX interval (ms) | Default period for this node’s transmit PDOs when a PDO’s own interval is 0. 0 here means use the system default (100 ms). |
| Heartbeat consumer (ms) | If non-zero, expect a heartbeat from this node at least this often. After a timeout, the stack records a timeout and, if network manager is on, sends Start again to that node. 0 = do not monitor. |
| RX PDO timeout (ms) | If non-zero, each receive PDO must arrive within this period or a timeout is counted. Starts counting after configuration is applied (no need for a first frame). 0 = do not monitor. |
The CAN ID of a PDO on the wire is not only the COB base: it is COB base + node address. For example, TPDO1 base 0x180 + node 5 → CAN ID 0x185. The UI shows the effective ID when a PDO is selected.
PDOs are the cyclic data packets of CANopen. Each PDO belongs to a node and has a direction:
| Direction in the UI | Meaning |
|---|---|
| Transmit (encode) | We send on the bus. Values are read from input channels, packed into the frame, and transmitted. Use this to command a device (e.g. enable + target speed). |
| Receive (decode) | We listen on the bus. Incoming frames are unpacked into output channels. Use this to read status, feedback, temperatures, etc. |
0x200 (standard RPDO1 base when you are the master writing to a slave).0x180 (standard TPDO1 base for data from a slave).These defaults match the common predefined connection set; change the COB base if your device datasheet specifies different IDs.
| Setting | What it does |
|---|---|
| COB Base (hex) | Base COB-ID before adding the node address. Enter hex (with or without 0x). Effective CAN ID = base + node address (7-bit). |
| Direction | Transmit (encode) or Receive (decode). |
| Interval (ms) | (TX only) How often to send when using cyclic async. 0 = use the node’s Default TX interval, or 100 ms if that is also 0. |
| Inhibit (ms) | (TX only) Minimum time between two sends of this PDO, even if interval or event would fire sooner. 0 = no extra limit. Useful to avoid flooding the bus. |
| TX type | (TX only) When the PDO is sent (see below). |
| Type in UI | Behaviour |
|---|---|
| Cyclic async (255) | Send on a timer (interval). Most common for continuous control. |
| Event async (254) | Send when the encoded channel values change (and not more often than inhibit allows). First send happens once after enable. |
| Sync every 1 / 10 | Send after every 1st or 10th SYNC frame (when a SYNC producer exists on the bus — this device or another). |
Receive PDOs do not use interval / inhibit / TX type. They decode any matching frame as it arrives.
Displayed for the selected PDO:
Example:
| COB base | Node | CAN ID on the wire |
|---|---|---|
0x200 | 1 | 0x201 |
0x180 | 4 | 0x184 |
0x280 | 10 | 0x28A |
For a TX PDO, encode entries pack channel values into the 8-byte payload.
| Setting | What it does |
|---|---|
| Input Channel | Channel whose live value is packed into the frame. Leave unassigned until you choose a channel. |
| Signed | Treat the packed value as signed (two’s complement) when applying mask/shift. |
| Mask (hex) | Bits kept after scaling (e.g. 0xFF for 8-bit, 0xFFFF for 16-bit). |
| Left Shift | Shift left after mask (for packing bit fields into a byte/word). |
| Multiplier | Physical value is multiplied then rounded to an integer raw value. Example: frequency 50.5 with multiplier 10 → raw 505. Must not be zero. |
| Byte Index (0–7) | Starting byte in the 8-byte payload (little-endian multi-byte fields). |
| Byte Count | Width: 1, 2, or 4 bytes. |
Multiple encode fields can share a byte (values are ORed into the payload), which is useful for bit-packed flags.
LayoutByte index + byte count must fit in 8 bytes (e.g. byte index 7 and count 2 is invalid and will not be written).
For an RX PDO, decode entries unpack the payload into channels.
Same idea as encode: list of fields with channel + byte position.
| Setting | What it does |
|---|---|
| Output Channel | Channel that receives the decoded physical value. |
| Signed | Sign-extend using the highest bit of the mask. |
| Mask (hex) | Bits kept after right-shift. |
| Right Shift | Shift right before mask (extract bit fields). |
| Multiplier | Physical value = raw / multiplier. Example: raw 505 with multiplier 10 → 50.5. Must not be zero. |
| Byte Index (0–7) | Starting byte in the payload. |
| Byte Count | 1, 2, or 4 bytes, little-endian. |
0x200 is often correct for RPDO1).0x180 for TPDO1) and decode status feedback into channels.Device expects target speed × 10 as unsigned 16-bit little-endian at bytes 2–3:
| Encode field | Value |
|---|---|
| Input channel | Your target speed channel |
| Signed | Off |
| Mask | 0xFFFF |
| Left shift | 0 |
| Multiplier | 10 |
| Byte index | 2 |
| Byte count | 2 |
Per CAN bus index (1–4), the firmware publishes counters you can log or display:
| Channel (pattern) | Meaning |
|---|---|
| CANopen n Tx Count | Number of CANopen frames transmitted on that bus instance. |
| CANopen n Rx Count | Matching CANopen frames received/processed (PDO/HB/EMCY etc., as counted by the stack). |
| CANopen n Rx Timeout Count | Timeouts: RX PDO silence, heartbeat consumer loss, or receive-queue overload. |
If TX count stays at zero: confirm CANopen Enable, node Enabled, PDO is Transmit, configuration has been applied to the device, and the CAN bus is online.
These are industry-standard bases; many devices use them by default:
| Function | Base (hex) | Full ID |
|---|---|---|
| NMT | 0x000 | Always 0x000 |
| SYNC | 0x080 | 0x080 |
| EMCY | 0x080 | 0x080 + node |
| TPDO1 (from device) | 0x180 | 0x180 + node |
| RPDO1 (to device) | 0x200 | 0x200 + node |
| TPDO2 / RPDO2 | 0x280 / 0x300 | + node |
| TPDO3 / RPDO3 | 0x380 / 0x400 | + node |
| TPDO4 / RPDO4 | 0x480 / 0x500 | + node |
| Heartbeat | 0x700 | 0x700 + node |
Always confirm against the device manual — some products use custom COB-IDs.
| Symptom | Things to check |
|---|---|
| Nothing on the bus | CANopen Enable; correct CAN bus and bit rate; termination; config applied to the unit. |
| TX count not increasing | Node Enabled; PDO direction Transmit; at least one encode entry (payload may still send zeros). |
| RX channels stay stale | COB base + node address match the device; byte layout and multiplier; device is operational (NMT / power). |
| Heartbeat timeouts | Consumer period longer than the device’s heartbeat producer period; correct node address; master not required for HB decode. |
| Wrong values | Multiplier direction (encode ×, decode ÷); signed vs unsigned; little-endian byte order; mask/shift. |
| Import overwrote settings | Import replaces this bus’s CANopen section only — re-export a known-good .canopen backup before experimenting. |
Functions → Timing → Stage
Stage Timing measures one continuous segment from start to finish — stage rally, hill climb, or any point-to-point run. It does not count laps. Runs save to the Timing Run Library.
Check Enable and set the speed channel (km/h). Distance can be integrated from speed or read from a distance channel.
| Stage | Typical use |
|---|---|
| Arm | Staging before the clock (switch, edge/level conditions, event, or Auto). |
| Start | Clock starts (start line event, green light, or conditions). |
| Finish | Clock stops. Prefer Event mapped to a Finish Beacon from a geo finish line under Locations & lines, or a dedicated finish event. |
| Abort | Condition, event, or speed-drop while running. |
Unlike circuit timing, stage does use Finish Beacon for the finish line. Circuit S/F uses Lap Beacon only.
Stage Time Delta is distance-matched against the stage run set as reference in the Run Library (current time − reference time at the same distance). Negative means ahead of the reference.
| Channel | Description |
|---|---|
| Stage State | Disabled / Idle / Armed / Running / Finished / Aborted |
| Stage Time | Elapsed stage time |
| Stage Distance | Distance covered |
| Stage Time Delta | Live distance-matched Δ vs library reference |
Events: Stage Start, Stage Finish, Stage Abort (when those transitions occur).
Functions → Timing → Run Library
The Timing Run Library stores finished (and aborted) runs from Circuit, Drag, and Stage timing on the device. Use it to compare live runs against a past result, or to show a past result on the dash.
Legacy circuit .trk files are no longer used. Best laps and trajectories come from this library.
When connected to a device, the page lists runs with discipline, location, time, and duration.
| Role | Purpose |
|---|---|
| Reference | Live deltas while you race or stage. Circuit and drag engines load the selected run’s times and trajectory. |
| Review | Display-only: show a past run’s times on **Timing Review *** channels without changing live delta behaviour. |
Clear reference removes the ghost so circuit Δ falls back to the current outing’s best lap, and stage/drag live library deltas stop.
You can also step reference on the device with virtual-button events (Timing Reference Next / Prev / Best / Clear) if those events are wired on a page.
Set as review (or copy reference → review) fills Timing Review channels for gauges that should show a historical result without affecting live deltas.
| Discipline | Duration / reference time shown |
|---|---|
| Circuit | Best lap time of the outing (not total race time). |
| Drag | Elapsed strip time (typically 1/4 mile). |
| Stage | Total stage time. |
Timing Reference Time on the bus matches that representative time for the selected reference run.
Reference group (live ghost metadata): run id, label, location, time, distance, mode, plus discipline-specific splits (drag markers, circuit best lap / sectors).
Review group: same idea for display-only selection, including stage review time/distance.
Library count reflects how many runs match the current filter.
Alarms monitor the system at runtime and notify the operator when something requires attention. Each alarm evaluates a set of trigger conditions every update cycle and, when active, broadcasts its message through dedicated system channels.
Alarms are processed in list order — position 1 is the highest priority, position 2 is lower, and so on. When multiple alarms are active simultaneously, only the highest-priority active alarm (lowest list index) is shown on the alarm channels at any given time.
The alarm list can be reordered by dragging, and individual alarms can be exported to .alarm files for reuse.
| Field | Description |
|---|---|
| Message | The text displayed on the alarm message channel. |
| Enabled | When unchecked the alarm is permanently disabled and will never fire. Disabled alarms are indicated by “(Disabled)” in the list. |
Defines when the alarm becomes active. Uses the standard condition editor — see Conditions for full details on comparisons, CH mode, and logic operators.
The alarm activates on the first update cycle where all conditions evaluate to true (subject to the hold-off timer — see Timing below).
| Field | Description |
|---|---|
| Auto Acknowledge | When enabled, the alarm clears itself automatically after a fixed duration. |
| Auto Acknowledge After (s) | Duration in seconds before the alarm auto-clears. Only visible when Auto Acknowledge is on. |
| Acknowledge on Event | An event channel that, when it fires, immediately clears the alarm regardless of whether the trigger conditions are still true. |
Manual and automatic acknowledgement both set the alarm inactive and clears the auto-acknowledge timer.
| Field | Description |
|---|---|
| Repeat Hold Off (s) | Minimum time (seconds) before the same alarm can fire again after it clears. Prevents rapid re-triggering if the condition oscillates around the threshold. |
With Auto Acknowledge: the hold-off starts from when the alarm auto-clears.
Without Auto Acknowledge: the hold-off starts the moment the alarm first fires, so the alarm can only re-fire this many seconds after it was last triggered.
| Field | Description |
|---|---|
| Show Value From | A channel whose live value is formatted and written to the alarm value channel alongside the message. Useful for showing e.g. “Water Temp: 102.4 °C”. The format respects the channel’s configured decimal places and units. |
| Active Status Channel | A channel that is set to 1 while this alarm is active and 0 otherwise. Wire this to anything that needs to react to one specific alarm independently of priority. |
While any alarm is active, the device writes the winning alarm’s data to system-wide channels every update cycle:
| Channel | Content |
|---|---|
| Alarm Message | The message string of the highest-priority active alarm. Set to "No Alarms" when all alarms clear. |
| Alarm Value | The formatted value of the alarm’s “Show Value From” channel, e.g. "102.4 °C". Empty string if no value channel is set. |
| Alarm Priority | 1-based index of the highest-priority active alarm. Set to (total alarms + 1) when all clear. |
| Alarm Begin | An event fired once when the system transitions from no active alarms to one or more active alarms. |
| Alarm End | An event fired once when the last active alarm clears. |
These channels can be used to drive displays, overlays, logging triggers, or any other part of the system.
Produces Channels and/or Events based on programmable conditions.
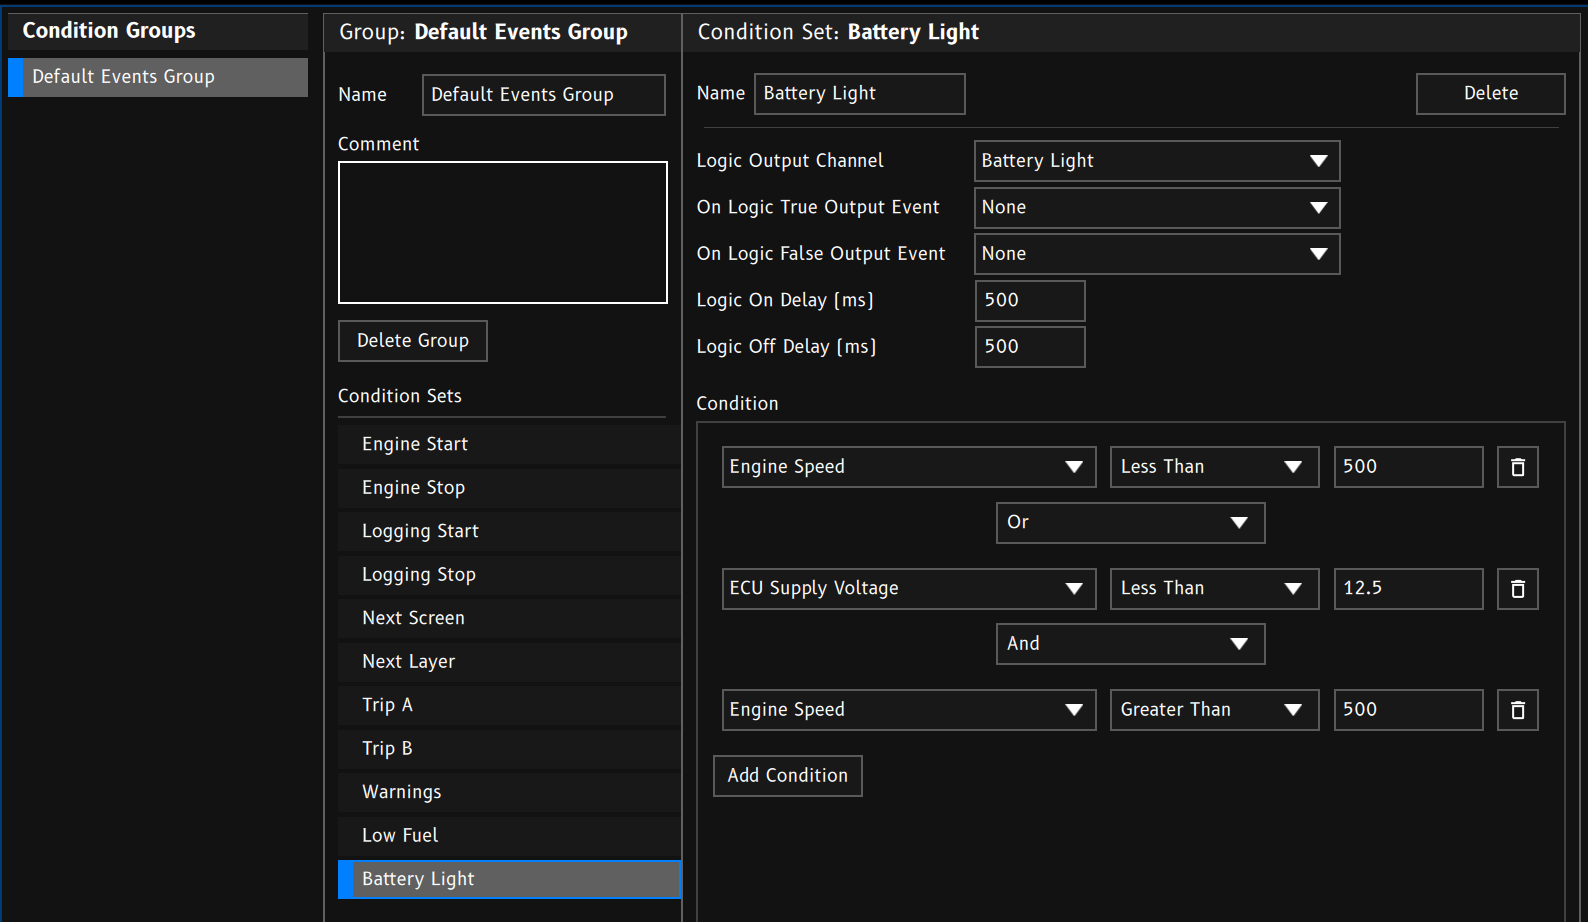
Logic Output Channel is the channel that will be produced when the condition is met. It’s value will be 1 when true, 0 when false.On Logic True Output Event is produced when the condition becomes true.On Logic False Output Event is produced when the condition becomes false.Logic On Delay is the time in milliseconds that the logic output will be delayed after the condition is met.Logic Off Delay is the time in milliseconds that the logic output will be delayed after the condition is no longer met.Conditions are the trigger logic used throughout the system — in alarms, virtual inputs, conditional logic, and more. A condition set is a list of one or more individual conditions combined with logic operators.
Each condition compares a channel value against a threshold and returns true or false.
| Field | Description |
|---|---|
| Channel | The channel whose live value is read as the left-hand side (LHS) of the comparison. |
| Comparison | The operator to apply (see table below). |
| RHS | The right-hand side — either a fixed constant (# mode) or a second live channel (CH mode). |
| Name | Meaning | RHS needed |
|---|---|---|
| Always False | Always evaluates to false regardless of channel value. | No |
| Greater Than | LHS > RHS | Yes |
| Less Than | LHS < RHS | Yes |
| Equal | LHS == RHS | Yes |
| Not Equal | LHS ≠ RHS | Yes |
| Greater Than Or Equal To | LHS ≥ RHS | Yes |
| Less Than Or Equal To | LHS ≤ RHS | Yes |
| Always True | Always evaluates to true regardless of channel value. | No |
The small # / CH toggle to the left of the RHS field switches modes:
# mode — compare against a fixed number you type in.CH mode — compare against the live value of a second channel. This lets you express relationships like “Engine RPM > Target RPM” or “Oil pressure < Minimum oil pressure”.In CH mode the live value of the RHS channel is shown alongside the LHS value so you can see both sides in real time.
The coloured dot at the left of each condition row shows its current evaluation result:
| Colour | Meaning |
|---|---|
| Green | Condition is currently true. |
| Red | Condition is currently false. |
| Grey | No live data available yet (channel not yet received). |
The dot updates every realtime frame — you can watch conditions transition as the system runs without needing to save or trigger anything.
When a condition set contains more than one condition, a logic operator sits between each pair and controls how they are combined.
| Operator | Meaning |
|---|---|
| AND | Both sides must be true. |
| OR | At least one side must be true. |
| NOR | Neither side may be true (true only when both are false). |
Important: Logic operators are evaluated strictly left to right. There is no AND-before-OR precedence as you might expect from mathematics or programming languages.
Given conditions A, B, C with operators between them:
Evaluates as:
And:
Evaluates as:
This means the order of your conditions matters. If you need AND to bind tighter than OR, place the AND conditions consecutively at the top of the list.
You want: “Water temp high AND (RPM above idle OR load above 50%)”
With left-to-right evaluation you cannot express this directly in one flat list. Instead, split it across two condition sets, or reorder so the OR comes first:
Evaluates as ((RPM > 1000) OR (Load > 50)) AND (Water > 95) — which is correct for this case because the AND is last.
This document provides comprehensive documentation for all gauge types available in the Emtron Displays.
All gauges share these common configuration properties:
| Property | Description |
|---|---|
Channel ID | The channel ID to read data from |
X Position | X position on screen (pixels) |
Y Position | Y position on screen (pixels) |
Width | Width of the gauge (pixels) |
Height | Height of the gauge (pixels) |
Opacity | Opacity level (0-100) |
Z Layer | Z-ordering layer (higher values render on top) |
TestValue | Value used during testing/preview |
TestValueMin | Minimum test value |
TestValueMax | Maximum test value |
Displays static text on the screen. This gauge renders during the static content phase and does not change with channel values.
| Property | Description |
|---|---|
Colour | Hex color code (e.g., “#FFFFFF”) |
Text | The text to display |
Pixel Size | Font size in pixels |
Horizontal Alignment | Horizontal alignment (AlignLeft, AlignHCenter, AlignRight) |
Vertical Alignment | Vertical alignment (AlignTop, AlignVCenter, AlignBottom) |
Font | Font file path (empty = default font) |
Displays numeric channel values with optional decimal places and color thresholds.
| Property | Description |
|---|---|
Colour | Default text color (hex code) |
Decimal Places | Number of decimal places to display |
Pixel Size | Font size in pixels |
Horizontal Alignment | Horizontal alignment |
Vertical Alignment | Vertical alignment |
Low Colour | Color when value ≤ lowColourThreshold |
Low Colour Threshold | Threshold for low color |
High Colour | Color when value ≥ highColourThreshold |
High Colour Threshold | Threshold for high color |
Font | Font file path (empty = default font) |
GetStringTexture for renderingDisplays time values in M:SS.mmm format (minutes:seconds.milliseconds) with threshold-based coloring.
| Property | Description |
|---|---|
Colour | Default text color (hex code) |
Pixel Size | Font size in pixels |
Horizontal Alignment | Horizontal alignment |
Vertical Alignment | Vertical alignment |
Low Colour | Color when value ≤ lowColourThreshold |
Low Colour Threshold | Threshold for low color |
High Colour | Color when value ≥ highColourThreshold |
High Colour Threshold | Threshold for high color |
Font | Font file path (empty = default font) |
[-]M:SS.mmmDisplays a filled bar that grows/shrinks based on channel value. Supports multiple directions and color modes.
| Property | Description |
|---|---|
Min Value | Minimum value for 0% fill |
Max Value | Maximum value for 100% fill |
Colour | Color for SingleColour mode (hex code) |
Direction | Fill direction (Left, Right, Up, Down, etc.) |
Invert | Invert the fill direction (true = empty on high values) |
Colour Type | SingleColour or MultiColour |
Mid Lower Value | Lower threshold for MultiColour mode |
Mid Upper Value | Upper threshold for MultiColour mode |
Min Colour | Color below midLowerValue (hex code) |
Mid Colour | Color between midLower and midUpper (hex code) |
Max Colour | Color above midUpperValue (hex code) |
Left (0) - Fills from right to leftRight (1) - Fills from left to rightUp (2) - Fills from bottom to topDown (3) - Fills from top to bottomUpLeft (4) - Fills diagonallyUpRight (5) - Fills diagonallyDownLeft (6) - Fills diagonallyDownRight (7) - Fills diagonallyinvert flips the ratio (1 - ratio)Rotates an image around a pivot point based on channel value. Supports linear and non-linear angle mapping.
| Property | Description |
|---|---|
File Name | Image file name (from images/ directory) |
Min Value | Value at minAngle |
Max Value | Value at maxAngle |
Min Angle | Starting angle in degrees |
Max Angle | Ending angle in degrees |
Pivot X | X coordinate of rotation pivot |
Pivot Y | Y coordinate of rotation pivot |
Direction | Clockwise or AntiClockwise |
Mapping Type | Linear or NonLinear |
Map | Non-linear mapping points |
| Property | Description |
|---|---|
Angle | Angle in degrees |
Value | Channel value at this angle |
Displays a static image. Can render in static or dynamic phase.
| Property | Description |
|---|---|
File Name | Image file name (from images/ directory) |
Force Foreground Render | If true, renders in dynamic phase; if false, in static phase |
RenderStaticContentRenderDynamicContentDisplays a progressively revealed image based on channel value. The image is “uncropped” as the value increases.
| Property | Description |
|---|---|
File Name | Image file name (from images/ directory) |
Min Value | Value at 0% reveal |
Max Value | Value at 100% reveal |
Direction | Direction of reveal |
Invert | Invert the reveal direction |
invert flips the ratioSame as Bar Gauge: Left, Right, Up, Down, UpLeft, UpRight, DownLeft, DownRight
Displays an image with circular/radial cropping based on channel value. Creates a “pie chart” or “arc” effect.
| Property | Description |
|---|---|
File Name | Image file name (from images/ directory) |
Min Value | Value at startAngle |
Max Value | Value at sweepAngle |
Start Angle | Starting angle in degrees (0° = top) |
Sweep Angle | Ending angle in degrees |
Direction | Clockwise or AntiClockwise |
Mapping Type | Linear or NonLinear |
Map | Non-linear mapping points |
Displays different images based on discrete channel values (acts like a switch statement).
| Property | Description |
|---|---|
Images | List of value-to-image mappings |
| Property | Description |
|---|---|
Value | Channel value to match (rounded to nearest integer) |
File Name | Image to display when value matches |
Fills a rectangle with color that transitions smoothly between three colors based on channel value.
| Property | Description |
|---|---|
Min Value | Value at minColour |
Mid Lower Value | Value where minColour → midColour transition completes |
Mid Upper Value | Value where midColour → maxColour transition starts |
Max Value | Value at maxColour |
Min Colour | Color at minimum value (hex code) |
Mid Colour | Color in middle range (hex code) |
Max Colour | Color at maximum value (hex code) |
Displays text with colored background based on discrete channel values. Similar to Multi Image but with text.
| Property | Description |
|---|---|
Pixel Size | Font size in pixels |
Horizontal Alignment | Horizontal text alignment |
Vertical Alignment | Vertical text alignment |
Texts | List of value-to-text mappings |
Font | Font file path (empty = default font) |
| Property | Description |
|---|---|
Value | Channel value to match (rounded to nearest integer) |
Text | Text to display |
Text Colour | Foreground text color (hex code) |
Background Colour | Background fill color (hex code) |
Manages multiple layers (screens within screens) that can be switched via events. Each layer contains its own set of gauges.
| Property | Description |
|---|---|
Layer Configs | List of layer definitions |
Next Layer Event | Event ID to switch to next layer |
Prev Layer Event | Event ID to switch to previous layer |
Name | Name of the layer group |
| Property | Description |
|---|---|
Layer ID | ID of the layer to display |
Is Default Layer | If true, shown on startup |
Show Event | Event ID to directly show this layer |
Displays live camera feed with optional flipping.
| Property | Description |
|---|---|
Flip Vertical | Flip image vertically |
Flip Horizontal | Flip image horizontally |
The gauge system uses a two-phase rendering approach:
Static Content Phase
Dynamic Content Phase
Gauges are rendered in order of their Z Layer property:
Colors are specified as hex strings:
"#RRGGBB" (e.g., “#FF0000” for red)Gauge not appearing:
Colors not working:
Images not loading:
Performance issues:
Layer group issues:
Emtron ED Series Displays contain 6 axis Inertial Measurement Unit (IMU).
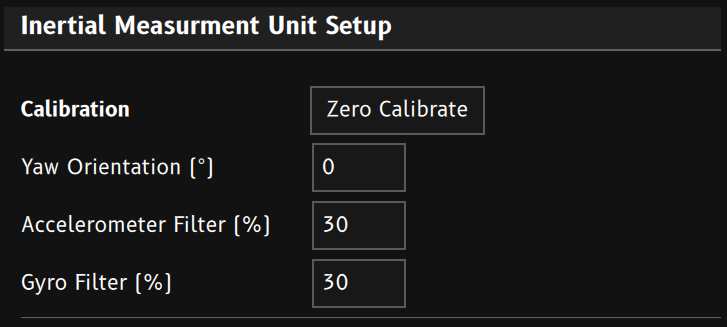
Zero Calibrate to put the IMU into calibration mode. The device will take 5 seconds worth of samples and find it’s vertical orientation. The calibration is stored in permanent memory in the device.G-Force Vertical should read close to 1.0G, while G-Force Lateral and G-Force Longitude should be 0.0G.G-Force Longitude should go positive when accelerating and negative when braking. G-Force Lateral should remain near zero.Yaw Orientation value until the Longitudinal and Lateral G-Forces are aligned correctly.In Field Calibration: Conditional Logic can be used to generate the
IMU Calibration Beginevent. This allows the IMU to be calibrated from a keypad button or similar user input.
Accelerometer Filter and Gyro Filter values control how filtered the IMU measurements are.Values are a percentage (0 - 99.9%). Higher filtering gives a cleaner signal, but slows down the signals rate of change. Use the least filtering you can get away with.
Typical values would be 10-40 %
The Lap Timing function outputs lap and timing data based triggered by lap beacon events.
Note: Lap and Race distance can be calculated from the speed input channel.
Three main events are used to control the lap timing function. These events can be triggered however you see fit. Typically they’re triggered by GPS position as configured in Track Setup.
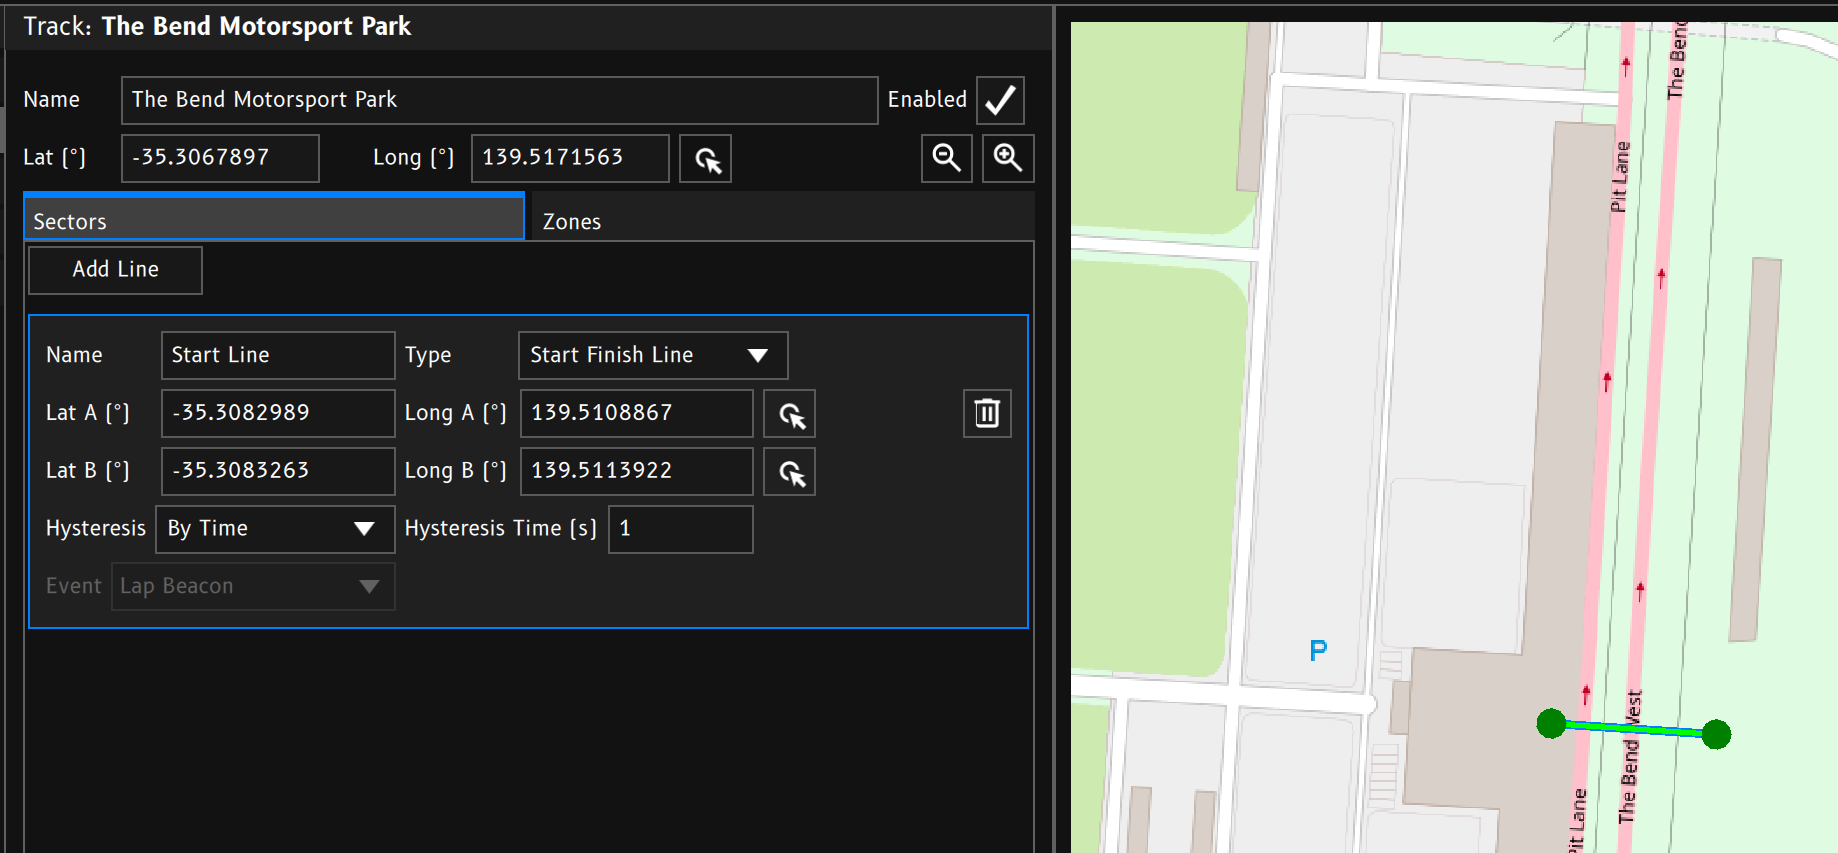
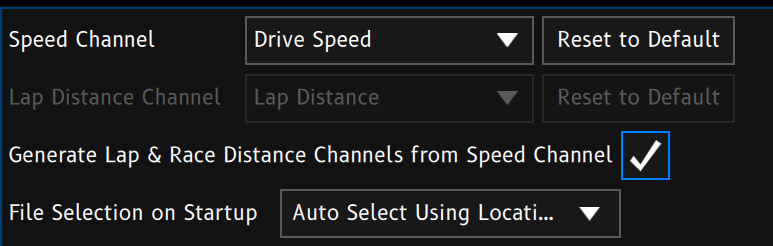
The selected speed channel is used to record speed data during the lap.
When Generate Lap & Race Distance Channels from Speed Channel is CHECKED, the Lap Distance and Race Distance channels hold values automatically calculated from the Speed Channel.
When Generate Lap & Race Distance Channels from Speed Channel is UNCHECKED, the selected Lap Distance channel is read and the data is stored in the current lap data.
If the Lap Count channel is generated and holds a non zero value, it is used to trigger the end of a race.
When the Lap Beacon event is triggered, and the Lap channel value equals the Lap Count channel value, the Current Lap (and sector) is ended. The Lap Timing system will wait for a new race to start.
When the Finish Beacon event is triggered, the Current Lap (and sector) is ended. The Lap Timing system will wait for a new race to start. This is useful for point to point or drag races.
The following channels are written to by the Lap Timing system.
The LIN (Local Interconnect Network) Bus configuration allows you to define frames and signals for LIN communication. LIN is a serial communication bus commonly used in automotive systems for low-speed, cost-effective data exchange.
Note: Currently, master mode only is supported. The system acts as the LIN master, controlling communication with slave devices on the bus.
Frames are the fundamental units of LIN communication. Each frame contains a PID (Protocol ID) and carries signals.
Displays all configured frames with their names and period (update interval in milliseconds). Use Add Frame to create a new frame, or Import Frame to load a previously saved frame.
Configure the following for each frame:
Visual representation of your frame layout showing how signals are distributed across the data bytes. Each colored line represents a signal, with a legend showing signal names below the diagram.
Each frame can contain multiple signals carrying data values.
Use Add Signal to add signals to a frame. The Export Frame button at the bottom saves the current frame configuration for reuse.
timeDelta)This is the variable name that will become available for use in the expression. Names must match [a-zA-Z_][a-zA-Z0-9_]*.
When checked, an additional variable will become available containing the derivative of the input channel. The derivative variable uses the standard variable name with a d prefix.
e.g. If the channel variable is EngineSpeed, then the derivative variable will be dEngineSpeed.
The derivative is computed from consecutive channel timestamps when the delta is at least 10 ms. If derivative is disabled, d{Name} is always 0.
Optional event channel (Continuous mode only). When the event fires, totalTime is reset to 0 on the next evaluation so gen.* waveforms can restart without recompiling. This does not clear filter or integrator state.
Changing the expression text triggers recompile and a full state reset (totalTime, filters, integrators).
Expressions are written using emexpr, Emtron’s expression language for real-time signal processing. Expressions are compiled once, then evaluated each tick to produce a single numeric output channel.
| Type | Examples |
|---|---|
| Integer | 42, 0x2A (hex), 0b1010 (binary) |
| Float | 0.5, .5, 1e-3, 2.5E+2 |
| Boolean | true, false (stored as 1 / 0) |
Line comments are supported: // everything after is ignored
| Name | Value |
|---|---|
PI | π |
E | e (Euler’s number) |
math.PI is also available as an alias for PI.
| Operator | Description | Example |
|---|---|---|
+ | Addition | rpm + 500 |
- | Subtraction | temp - 20 |
* | Multiplication | load * 0.5 |
/ | Division | fuel / 4 |
% | Modulus (remainder) | counter % 10 |
^ or ** | Exponent | x ^ 2 |
Returns 1 (true) or 0 (false).
| Operator | Description |
|---|---|
== | Equal to |
!= | Not equal to |
< | Less than |
> | Greater than |
<= | Less than or equal to |
>= | Greater than or equal to |
| Operator | Description |
|---|---|
&& or and | Logical AND |
|| or or | Logical OR |
! or not | Logical NOT |
Logical operators short-circuit: in a && b, b is not evaluated if a is falsy; in a || b, b is not evaluated if a is truthy.
A value is truthy when it is not 0 and not NaN. NaN is falsy — use util.IfNaN or math.IsNaN when you need explicit handling.
Example: rpm > 3000 ? 1 : 0
Use let to declare intermediate values within an expression. Separate statements with ;.
The last expression in the let body is the result.
| Name | Description |
|---|---|
timeDelta | Time since last evaluation of this expression, in seconds. In continuous mode this is the backend tick interval. In event mode it is 0.01 s. |
totalTime | Accumulated time since the first evaluation after compile (or since the last Reset totalTime event). Used by gen.* and util.DistanceDelta. |
previousResult | Output value from the previous evaluation of this expression. 0 on the first eval after compile. |
Functions in the filter, calc, and gen namespaces maintain state across evaluations. Each call site gets its own independent state slot — two filter.Exponential calls in the same expression do not share memory:
Several filters seed their internal state from the first sample on the first tick, so the first output may equal the first input rather than a neutral value.
All trig functions are in radians.
| Function | Description |
|---|---|
math.Sin(x) | Sine of x |
math.Cos(x) | Cosine of x |
math.Tan(x) | Tangent of x |
math.Asin(x) | Arcsine of x |
math.Acos(x) | Arccosine of x |
math.Atan(x) | Arctangent of x |
math.Atan2(y, x) | Quadrant-correct arctangent |
math.Hypot(p, q) | Hypotenuse of p and q |
math.Exp(x) | Base e exponential of x |
math.Abs(x) | Absolute value of x |
math.Log(x) | Natural log of x |
math.Log10(x) | Base-10 log of x |
math.Sqrt(x) | Square root |
math.Min(x, y) | Minimum |
math.Max(x, y) | Maximum |
math.Clamp(x, min, max) | Clamps x between min and max |
math.Pow(x, y) | x to the power of y |
math.Pow10(n) | 10 to the power of n |
math.Round(x) | Rounds to the nearest integer |
math.Floor(x) | Rounds toward −∞ |
math.Ceil(x) | Rounds toward +∞ |
math.Trunc(x) | Rounds toward zero |
math.Sign(x) | Returns −1, 0, or +1 |
math.Mod(x, y) | Floating-point remainder |
math.Deg2Rad(x) | Converts degrees to radians |
math.Rad2Deg(x) | Converts radians to degrees |
math.Blend(t, x, y) | Linear blend: (1−t)·x + t·y, with t clamped to [0, 1] |
math.Lerp(t, x, y) | Same as math.Blend |
math.Sq(x) | x² |
math.IsNaN(x) | Returns 1 if x is NaN, else 0 |
math.IsInf(x) | Returns 1 if x is ±Inf, else 0 |
| Function | Description |
|---|---|
filter.Exponential(input, alpha) | Exponential moving average. alpha is the smoothing factor (0.001–0.999). |
filter.MovingAverage(input, n) | Moving average over the last n samples. n must be constant (clamped to 1–1024). |
filter.Median(input, n) | Moving median over the last n samples. n should be an odd number. |
filter.RateOfChange(input, maxPositiveRatePerSecond, maxNegativeRatePerSecond) | Limits the rate of change of the input. Both rate limits are positive numbers. |
filter.Schmitt(input, lowValue, highValue) | Schmitt trigger. Returns 1 when above highValue, 0 when below lowValue. |
filter.DelayedSchmitt(input, lowValue, highValue, offTimeS, onTimeS) | Schmitt trigger with time delays in seconds. |
filter.LowPass(input, cutoffHz) | First-order low-pass filter. cutoffHz is the −3 dB corner frequency. |
filter.Deadband(input, width) | Ignores changes smaller than width. |
filter.Ramp(input, maxRate) | Limits output rate of change to maxRate units per second. |
filter.PeakHold(input, decayRate) | Tracks the maximum value seen, decaying at decayRate units per second. |
filter.Previous(input) | Returns the previous input sample. |
filter.HoldWhile(valid, input) | Passes input through while valid is truthy; otherwise returns the last held value. |
filter.ExponentialTau(input, tauSeconds) | EMA with time constant in seconds. |
filter.WindowMin(input, n) | Minimum over the last n samples. |
filter.WindowMax(input, n) | Maximum over the last n samples. |
| Function | Description |
|---|---|
calc.Integrate(input, deltaTime, initial, enable) | Running sum. When enable is truthy, accumulates input × deltaTime. When falsy, resets to initial. Typically deltaTime is timeDelta. |
calc.IntegrateClamped(input, deltaTime, initial, min, max, enable) | Same as calc.Integrate, but clamps the output between min and max. |
calc.Differentiate(input) | Numerical derivative: (input − previous) / timeDelta. |
calc.Timer(run, reset) | Elapsed-time timer in seconds. Increments while run is truthy; resets when reset is truthy. |
calc.Latch(value, set, reset) | Sample-and-hold latch. Captures value when set is truthy; clears when reset is truthy. |
calc.Rising(condition) | Returns 1 for one tick on a rising edge of condition, else 0. |
calc.Falling(condition) | Returns 1 for one tick on a falling edge of condition, else 0. |
calc.EdgeCount(condition, reset) | Counts rising edges of condition. Resets to 0 when reset is truthy. |
| Function | Description |
|---|---|
util.IfNaN(value, fallback) | Returns fallback if value is NaN, else value. |
util.IfInf(value, fallback) | Returns fallback if value is ±Inf, else value. |
util.SafeDiv(numerator, denominator, fallback) | Returns numerator / denominator, or fallback if denominator == 0. |
util.Scale(value, inMin, inMax, outMin, outMax) | Linear map from [inMin, inMax] to [outMin, outMax]. |
util.Within(value, lo, hi) | Returns 1 if lo ≤ value ≤ hi, else 0. |
util.Coalesce(a, b, …) | Returns the first argument that is not NaN (2–8 arguments). |
util.PercentError(measured, target) | ((measured − target) / target) × 100. |
util.Piecewise(x, x0, y0, x1, y1, …) | Piecewise-linear lookup table (up to 6 knots). |
util.DistanceDelta(speedMps) | Returns speedMps × timeDelta — distance travelled over the last tick. |
util.KphToMps(kph) | Converts km/h to m/s. |
util.MpsToKph(mps) | Converts m/s to km/h. |
Timed waveform generators. All use totalTime (seconds since first eval after compile or last reset event).
| Function | Description |
|---|---|
gen.Sine(frequencyHz, amplitude, offset) | Sine wave |
gen.Cosine(frequencyHz, amplitude, offset) | Cosine wave |
gen.Square(frequencyHz, amplitude, offset) | Square wave (50% duty) |
gen.Square(frequencyHz, amplitude, offset, duty) | Square wave with configurable duty cycle |
gen.Triangle(frequencyHz, amplitude, offset) | Triangle wave |
gen.Sawtooth(frequencyHz, amplitude, offset) | Rising sawtooth |
gen.Step(timeSeconds, valueBefore, valueAfter) | Step function at timeSeconds |
gen.Pulse(periodSeconds, amplitude, offset, pulseWidthSeconds) | Periodic pulse |
gen.Ramp(slope, min, max) | Ramp slope × totalTime, clamped to [min, max] |
gen.Noise(amplitude, offset, seed) | Deterministic pseudo-random noise |
gen.Chirp(startHz, endHz, durationSeconds, amplitude) | Linear frequency chirp |
Example — smoothed test signal:
The OBD2 Scanner module provides comprehensive vehicle diagnostics and data acquisition through the On-Board Diagnostics II (OBD2) protocol. This guide covers configuration, operation, and troubleshooting.
Enable OBD2 on CAN Bus
can0)Configure Service 0x01 (Current Data)
1 (0x01)Test Connection
Each OBD2 service (0x01, 0x09, 0x22, etc.) can be independently configured:
| Setting | Description | Default | Notes |
|---|---|---|---|
| Enabled | Enable this service | No | Must be enabled to poll |
| Service ID | OBD2 service number | - | 0x01 = Current Data, 0x09 = Vehicle Info |
| PID Width | Bytes per PID | 1 for 0x01 2 for others | Auto-detected |
| Batch PID Requests | Send multiple PIDs per request | No | Only for Service 0x01 |
| PID Discovery | Auto-detect supported PIDs | Yes | Recommended for compatibility |
| TX Address | CAN transmit ID | 0x7E0 (physical) 0x7DF (broadcast) | Physical for multi-PID |
| RX Address Start | Response CAN ID range start | 0x7E8 | Standard OBD2 |
| RX Address End | Response CAN ID range end | 0x7EF | Supports multiple ECUs |
For each PID you want to monitor:
| Setting | Description | Example |
|---|---|---|
| Enabled | Poll this PID | Yes |
| PID | Parameter ID | 0x0C = Engine RPM |
| Channel ID | Output channel | 60100 (custom channel) |
| Byte Count | Data bytes for this PID | 2 for RPM |
| Description | Human-readable name | “Engine RPM” |
| Decode Formula | Math expression to convert raw data | (A*256+B)/4 |
Monitor OBD2 system health through these channels:
| Channel | Description | Values |
|---|---|---|
| OBD2 Poll Rate | Complete polls per second | 0-100 Hz |
| OBD2 Response Rate | Success percentage | 0-100% |
| Channel | Description | Values |
|---|---|---|
| OBD2 Service N Status | Connection status | Disabled, Connected, No Response, PID Not Supported, Response Error |
| OBD2 Service N Response Code | Last error code | 0 = OK, 0x11 = Not Supported, 0x12 = Invalid, 0x31 = Out of Range |
| OBD2 Service N Supported PIDs 0x00-0xE0 | Bitmap of supported PIDs | Bitfield (32-bit) |
Real-time engine and vehicle parameters.
Configuration:
Common Use: Engine RPM, coolant temp, throttle position, vehicle speed
Static vehicle identification data.
Configuration:
Common Use: VIN, calibration IDs, ECU name
Manufacturer-specific extended data.
Configuration:
Common Use: Custom manufacturer parameters, advanced diagnostics
Request multiple PIDs in a single CAN message for faster polling.
Benefits:
Limitations:
Configuration:
Expected Poll Rate:
Automatically detect which PIDs your vehicle supports.
How It Works:
Benefits:
Retry Logic:
Convert raw PID data to engineering units using mathematical expressions.
Formula Variables:
A = First data byte (0-255)B = Second data byte (0-255)C = Third data byte (0-255)D = Fourth data byte (0-255)E to H = Additional bytes if neededExamples:
| PID | Description | Bytes | Formula | Unit |
|---|---|---|---|---|
| 0x00 | Supported PIDs 01-20 | 4 | - | Bitmap |
| 0x04 | Calculated Load | 1 | A*100/255 | % |
| 0x05 | Coolant Temp | 1 | A-40 | °C |
| 0x0A | Fuel Pressure | 1 | A*3 | kPa |
| 0x0B | Intake Manifold Pressure | 1 | A | kPa |
| 0x0C | Engine RPM | 2 | (A*256+B)/4 | RPM |
| 0x0D | Vehicle Speed | 1 | A | km/h |
| 0x0E | Timing Advance | 1 | (A-128)/2 | ° |
| 0x0F | Intake Air Temp | 1 | A-40 | °C |
| 0x10 | MAF Air Flow | 2 | (A*256+B)/100 | g/s |
| 0x11 | Throttle Position | 1 | A*100/255 | % |
| 0x1F | Runtime Since Start | 2 | A*256+B | seconds |
| 0x20 | Supported PIDs 21-40 | 4 | - | Bitmap |
| 0x2F | Fuel Tank Level | 1 | A*100/255 | % |
| 0x33 | Barometric Pressure | 1 | A | kPa |
| 0x40 | Supported PIDs 41-60 | 4 | - | Bitmap |
| 0x42 | Control Module Voltage | 2 | (A*256+B)/1000 | V |
| 0x46 | Ambient Air Temp | 1 | A-40 | °C |
| 0x5C | Engine Oil Temp | 1 | A-40 | °C |
| 0x60 | Supported PIDs 61-80 | 4 | - | Bitmap |
| PID | Description | Bytes | Notes |
|---|---|---|---|
| 0x00 | Supported PIDs | 4 | Bitmap |
| 0x02 | Vehicle Identification Number (VIN) | 17 | ASCII string |
| 0x04 | Calibration ID | Variable | ASCII string |
| 0x0A | ECU Name | Variable | ASCII string |
Symptoms: Status shows “No Response” or never connects
Causes:
Solutions:
500 kbps or 1 MbpsSymptoms: Status shows “PID Not Supported” with error code 0x11 or 0x12
Causes:
Solutions:
Symptoms: OBD2 Poll Rate < 1 Hz, data updates slowly
Causes:
Solutions:
Symptoms: OBD2 Response Rate < 80%, intermittent data
Causes:
Solutions:
Symptoms: Channel values don’t match expected ranges
Causes:
Solutions:
A, B, C, D for bytes)Symptoms: Values jump erratically between readings
Causes:
Solutions:
Symptoms: Service stuck in “Disabled” state, never reaches “Connected”
Causes:
Solutions:
Symptoms: Discovery completes but no PIDs are polled
Causes:
Solutions:
Goal: Achieve 10+ Hz poll rate for critical parameters
Strategy:
Expected Results:
Goal: Reduce CAN bandwidth usage
Strategy:
CAN Load Calculation:
Scenario: Monitor Service 0x01 (current data) and Service 0x09 (VIN)
Strategy:
Monitor essential engine parameters.
Configuration:
Expected Results:
High-speed data acquisition for track use.
Configuration:
Expected Results:
Complete vehicle parameter survey.
Configuration:
Expected Results:
Access extended manufacturer parameters.
Configuration:
Note: Manufacturer PIDs vary by make/model. Consult manufacturer documentation.
OBD2 Request (Single PID):
OBD2 Request (Multi-PID):
OBD2 Response:
For responses >7 bytes, ISO-TP (ISO 15765-2) is used:
First Frame:
Consecutive Frames:
| Code | Description | Meaning |
|---|---|---|
| 0x11 | Service Not Supported | ECU doesn’t support this service |
| 0x12 | Sub-Function Not Supported | PID not supported |
| 0x13 | Incorrect Message Length | Wrong data size |
| 0x31 | Request Out Of Range | PID out of valid range |
| 0x33 | Security Access Denied | Requires authentication |
| 0x78 | Response Pending | ECU busy, will respond later |
Regional Compliance: OBD2 is mandated for vehicles sold in:
Emissions Testing: Tampering with OBD2 data may violate emissions regulations
Warranty: Check vehicle warranty terms regarding aftermarket scanning
| Term | Definition |
|---|---|
| ECU | Electronic Control Unit - vehicle computer that manages engine/systems |
| PID | Parameter ID - specific data point (e.g., RPM, temperature) |
| ISO-TP | ISO 15765-2 Transport Protocol - multi-frame message handling |
| SAE J1979 | Standard defining OBD2 diagnostic protocols |
| UDS | Unified Diagnostic Services (ISO 14229) - extended diagnostics |
| DTC | Diagnostic Trouble Code - stored fault code |
| Freeze Frame | Snapshot of parameters when fault occurred |
| Bitmap | 32-bit field where each bit indicates support for a PID |
| Multi-PID | Requesting multiple parameters in single message |
| Physical Addressing | Direct ECU communication (0x7E0) vs broadcast (0x7DF) |
For additional help:
| Version | Date | Changes |
|---|---|---|
| 1.0 | 2025 | Initial release |
This guide explains how to configure and manage PID (Proportional-Integral-Derivative) controllers for process control. The guide covers how to set up controllers, assign channels, define conditions, adjust limits, configure gain tables, and monitor diagnostics for effective PID control.
A PID controller adjusts a process by calculating an error (difference between a desired set point and the measured process variable) and applying proportional P, integral I, and derivative D corrections to produce an output. This software allows you to configure multiple PID controllers, each with customizable channels, conditions, limits, and gain tables. Real-time diagnostic plots help monitor and tune controller performance.
Each PID controller requires four key channels:
Conditions define when the controller is active and how it behaves:
Fine-tune the PID terms and output with these settings:
Gain tables allow you to define variable gains for the PID terms based on operating conditions:
P, which scales the error to determine the proportional correction.I, which scales the accumulated error over time.D, which scales the rate of change of the error.Monitor controller performance with real-time diagnostic plots:
I and D to 0, then adjust P to achieve a stable but slightly oscillatory response.I to eliminate steady-state error, but watch for integral windup (use the “Integral Reset When” condition to mitigate this).D to dampen oscillations, but avoid high values to prevent noise amplification. Consider “Derivative of Measurement” mode for noisy systems.P, I, and D based on operating conditions (e.g., higher P for larger errors).P, I, D) affects the output. Adjust limits if any term dominates unexpectedly.P, I, D, and final output limits to prevent excessive corrections that could damage the system.This guide covers the core PID configuration features to help you set up and tune controllers effectively.
The shift calculation writes to the Shift Indication channel. The value progresses from 1 to 99, then 100 when the 100% value is met or exceeded.
If you don’t want to use the shift calculation, set the input channel to ‘None’.
The shift patterns are selected based on the input channel value. The pattern with the nearest value equal to or less than the input channel value is displayed.
TIP: Drag the LEDs to copy the colours around
Speed Fusion combines data from multiple sensors to produce a single, accurate speed measurement that is more reliable than any individual source. It draws on GPS speed, drive speed (from the ECU or CAN bus), wheel speed sensors, and IMU data (accelerometer and gyroscope) to deliver a smooth, low-latency fused speed output.
Speed Fusion continuously monitors for wheel slip and automatically reduces the influence of any sensor that appears unreliable, such as a spinning driven wheel under hard acceleration.
| Setting | Description |
|---|---|
| Enabled | Turns Speed Fusion on or off. When disabled, no fused speed is produced. |
Assign each input to the channel that provides that sensor’s data. Leave a channel unassigned if that sensor is not available — Speed Fusion will simply use whichever sources are connected.
| Input | Description | Units |
|---|---|---|
| Drive Speed | Speed from the vehicle ECU or CAN bus | kph |
| GPS Speed | Speed from the GPS receiver | kph |
| Front-Left Wheel Speed | Individual wheel speed sensor | kph |
| Front-Right Wheel Speed | Individual wheel speed sensor | kph |
| Rear-Left Wheel Speed | Individual wheel speed sensor | kph |
| Rear-Right Wheel Speed | Individual wheel speed sensor | kph |
| Longitudinal Acceleration | Forward/backward acceleration from IMU | m/s² |
| Vertical Acceleration | Up/down acceleration from IMU | m/s² |
| Pitch Rate | Nose-up/nose-down rotation rate from IMU | °/s |
Indicate which wheels are driven (powered) by the motor. Speed Fusion prefers non-driven wheels for speed estimation because driven wheels are more likely to slip under acceleration.
| Setting | Description |
|---|---|
| Front-Left Driven | Enable if this wheel is driven |
| Front-Right Driven | Enable if this wheel is driven |
| Rear-Left Driven | Enable if this wheel is driven |
| Rear-Right Driven | Enable if this wheel is driven |
Examples:
When all wheels are driven, Speed Fusion still uses wheel speeds but treats them as less reliable and relies more heavily on GPS and drive speed.
These settings control how much Speed Fusion trusts each sensor source, and how aggressively it detects wheel slip. The defaults are appropriate for most vehicles — only adjust these if you observe specific problems.
Lower values mean more trust in that source; higher values mean less trust. Think of these as a confidence level for each sensor’s accuracy.
| Parameter | Default | Description |
|---|---|---|
| GPS Speed Trust | 1.0 kph | How much variation is expected in the GPS speed reading |
| Drive Speed Trust | 0.5 kph | How much variation is expected in the drive speed from the ECU/CAN |
| Wheel Speed Trust | 0.3 kph | How much variation is expected in wheel speed readings |
| Speed Responsiveness | 1.0 kph | How freely the fused speed estimate can change between updates — increase if output lags, decrease if output is jittery |
| Vertical Accel Trust | 3.0 m/s² | How closely vertical acceleration tracks expected gravity — higher values allow more pitch angle variation |
| Parameter | Default | Description |
|---|---|---|
| Slip Gate | 10.0 kph | Maximum allowable difference between a sensor reading and the current speed estimate before that reading is rejected. Increase if valid readings are being discarded during hard acceleration; decrease if bad readings are affecting the output. |
| Acceleration Slip Threshold | 3.0 m/s² | How large an acceleration mismatch between wheel sensors and the IMU must be before wheel slip is declared. Lower values detect slip earlier; higher values only flag severe slip. |
The defaults work well for most vehicles. Before adjusting anything, verify that all configured channels are receiving valid data and that sensor units are correct (speeds in kph, acceleration in m/s²).
| Symptom | Adjustment |
|---|---|
| Fused speed lags behind actual speed | Increase Speed Responsiveness |
| Fused speed is jittery or noisy | Decrease Speed Responsiveness, or increase the trust value for the noisiest sensor |
| Wheel slip not being detected | Decrease Acceleration Slip Threshold |
| Valid readings incorrectly rejected during acceleration | Increase Slip Gate |
| GPS signal is unreliable (tunnels, urban areas) | Increase GPS Speed Trust to reduce GPS influence |
| Drive speed source has noticeable latency | Increase Drive Speed Trust to reduce its influence |
| Problem | Likely Cause | Solution |
|---|---|---|
| No fused speed output | Speed Fusion is disabled, or no sensor channels are configured | Enable Speed Fusion and verify at least one speed input is assigned |
| Fused speed lags actual speed | Speed Responsiveness is too low | Increase Speed Responsiveness |
| Fused speed is jittery | Sensor trust values are too low (over-trusting noisy sensors) | Increase trust values for noisy sources |
| Wheel slip not detected | Acceleration Slip Threshold is too high | Decrease Acceleration Slip Threshold |
| Valid measurements rejected | Slip Gate is too tight | Increase Slip Gate |
| Pitch angle appears incorrect | IMU sensor orientation or calibration issue | Verify accelerometer and gyroscope channel assignments and sensor mounting |
Switch Inputs allow any input channel to be used for binary switch logic. The output is either 0 when inactive/off or 1 when active/on.
The channel used as the input value source.
The channel that contains the final result of the switch logic.
Determines the switches behaviour.
Low Threshold. Does not transition back to OFF until the input is greater than or equal to High Threshold. Typical use: Low side switch.High Threshold. Does not transition back to OFF until the input is less than or equal to Low Threshold. Typical use: High side switch.Low Threshold AND the input is less than or equal to High Threshold. Typical use: Voltage ladder switches such cruise control buttons or other steering wheel controls.Low Threshold AND the input is greater than or equal to High Threshold. Typical use: Inverse voltage ladder. Can determine when single position is not pressed.Note:
Togglemode will alter the behaviour described here. See below…*
Input comparison high value. Used by all Detection Modes.
Must be greater than Low Threshold.
Input comparison low value. Used by all Detection Modes.
Must be less than High Threshold.
Hysteresis value used on both the Low Threshold and High Threshold boundaries.
Only applies to Detection Modes Active Inside Range and Active Outside Range.
Active Inside Range: The switch will turn ON when the input is inside the threshold boundaries. In order to turn off, the input must be less than Low Threshold - Range Hysteresis OR greater than High Threshold + Range Hysteresis. The activation window is effectively widend when in the ON state.
Active Inside Range: The switch will turn ON when the input is outside the threshold boundaries. In order to turn off, the input must be greater than Low Threshold + Range Hysteresis AND less than High Threshold - Range Hysteresis. The activation windows are effectively widend when in the ON state.
Alters the behaviour of the output. When the input detection is determined to be in the ON state, rather than following that state, the output value will toggle from OFF to ON and ON to OFF with each successive transition. This allows a momentary switch or keypad button to toggle (latch) each time it is pressed.
Inverts the output result. OFF becomes ON and ON becomes OFF.
Tables function similarly to ECU tables, featuring an X and Y axis where channels are assigned as inputs.
The system looks up the corresponding table value and outputs it to the assigned channel. Values are interpolated between cells to ensure a smooth output.
There is no limit to the number of tables you can create.
Track Setup determines how GPS based Lap Timing functions.
Lap Timing and Track Setup are separated so that other systems can also generate the lap and sector beacons. This allows the use of other timing systems such as laser beacons.

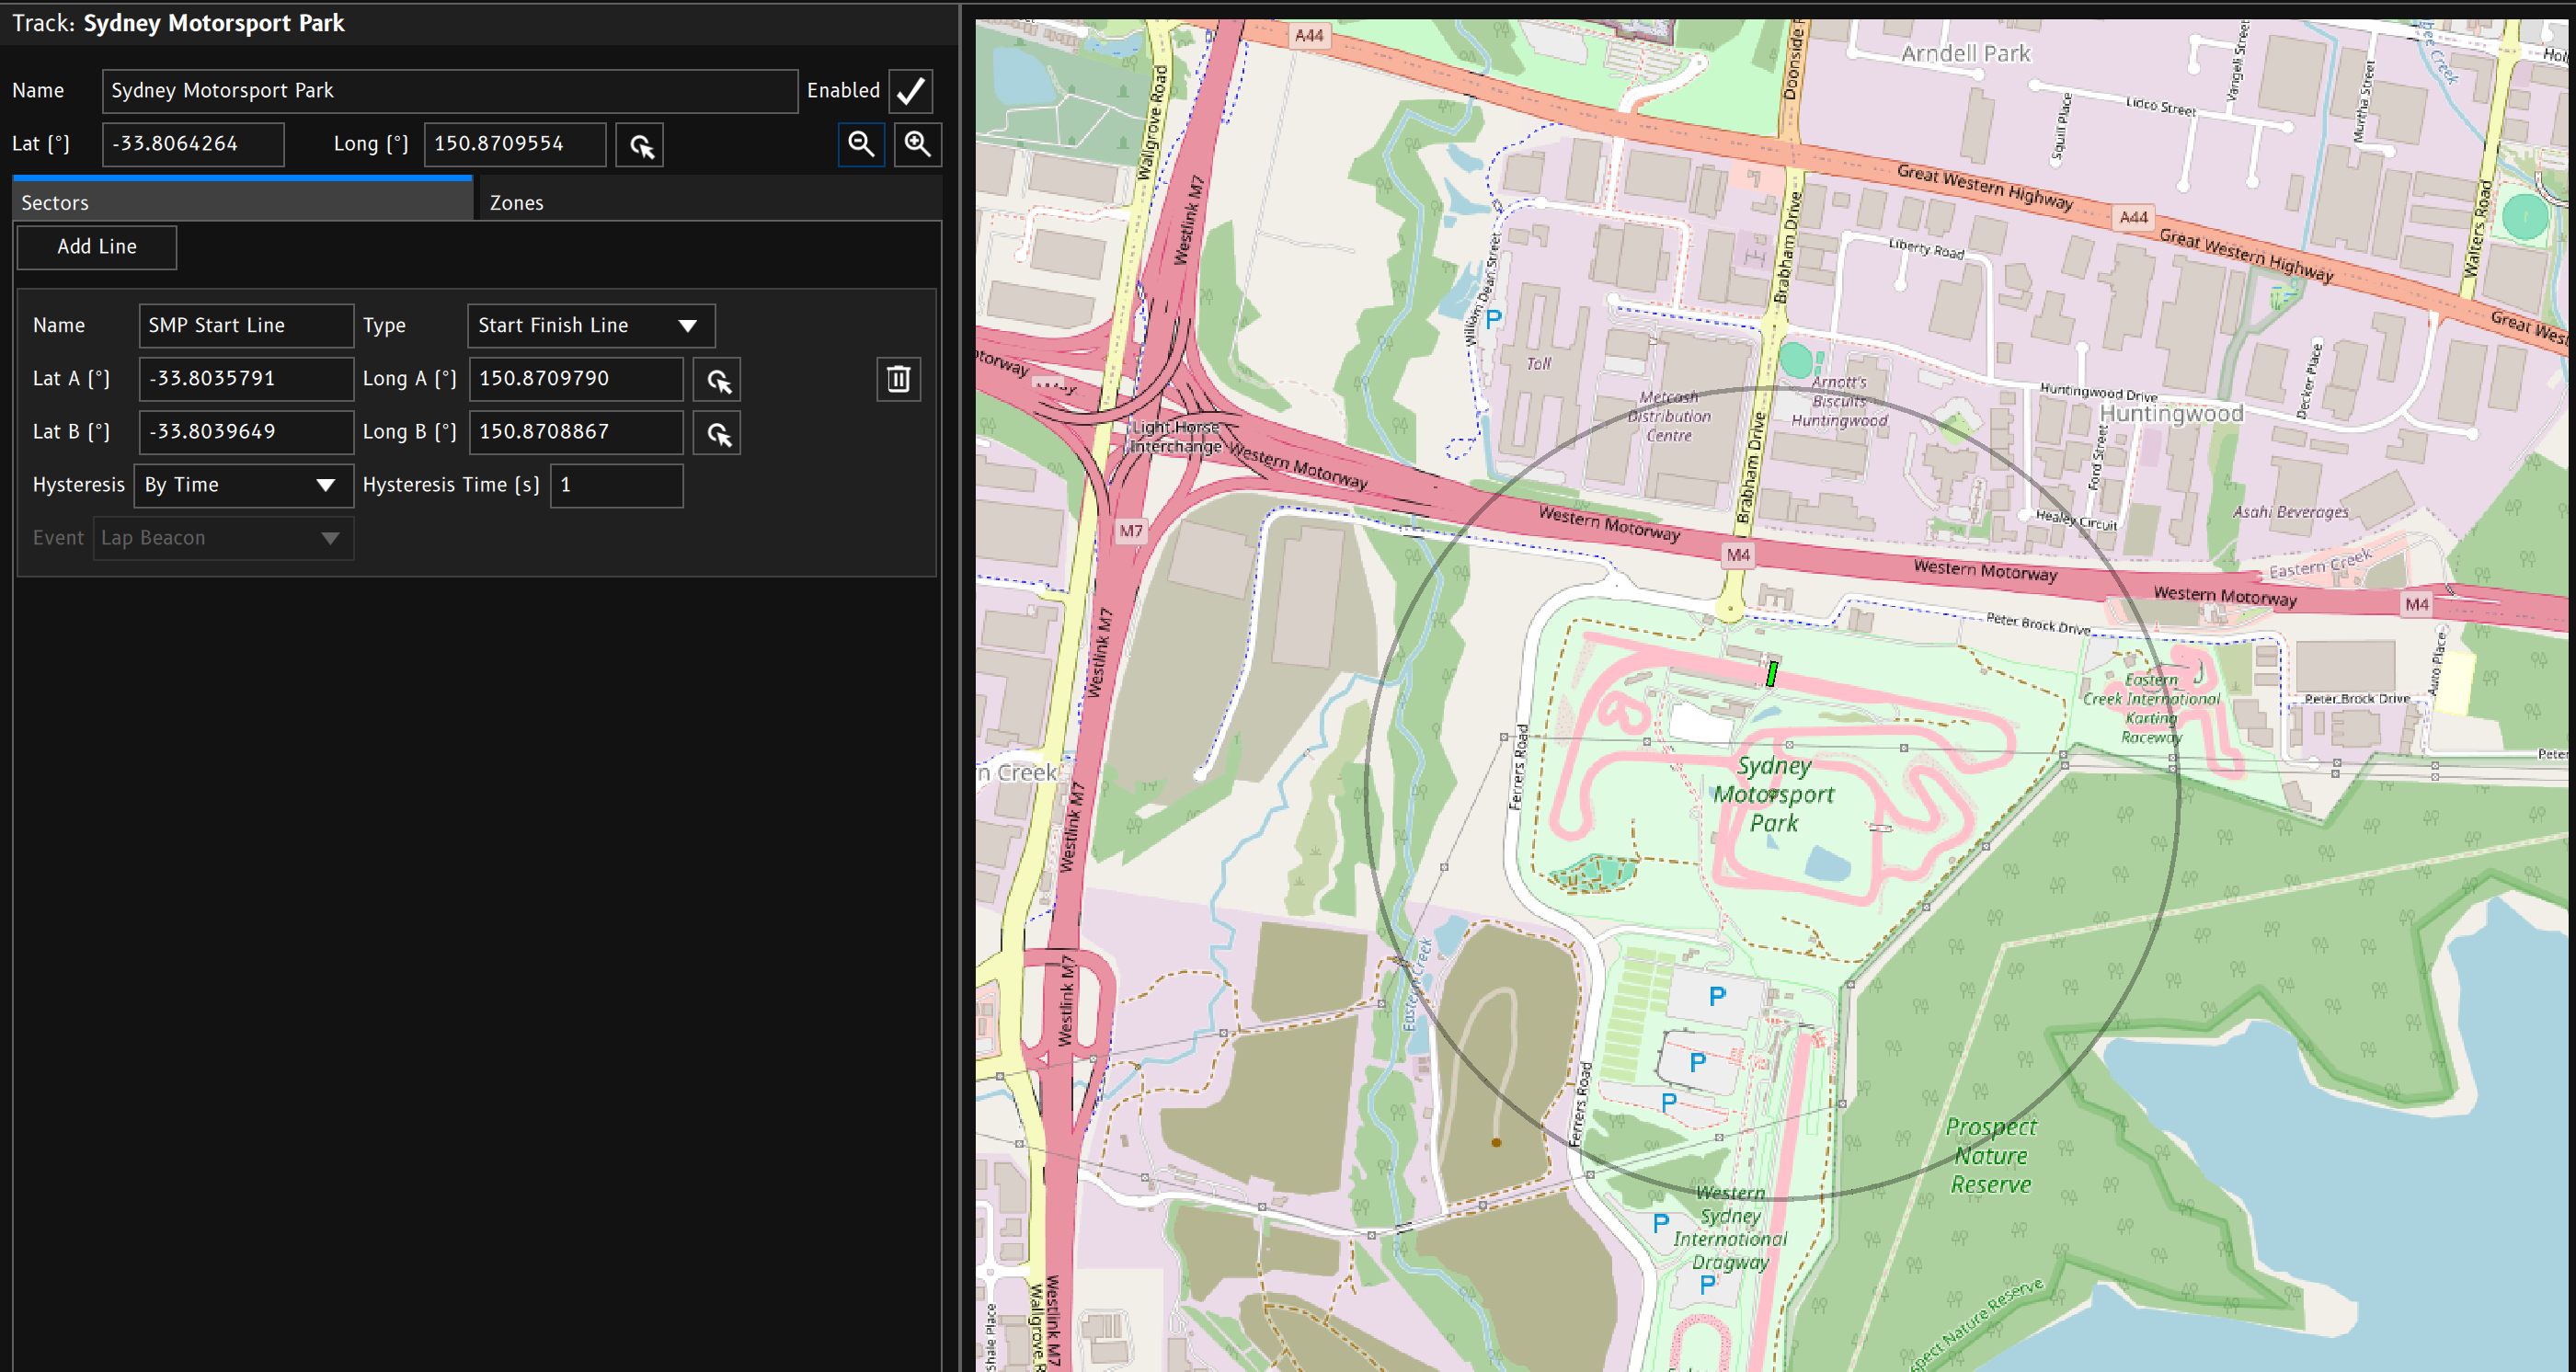
Each track has a central GPS position. This allows the device to select the track as the active track when it detects itself inside the detection radius of a particular track.
Note: To use automatic track location detection,
Startup Track Selectionneeds to be set toAuto Select Using GPS.
Alternatively, tracks can be selected manually by assigning events to the Select Previous Track Event and/or Select Next Track Event options.
Tracks are essentially a collection of GPS coordinates that allow the device to output sector and lap beacons as well as zone detection.
The track’s Latitude and Longitude values are used to set the position of the map window as well as automatic location detection.
To quickly adjust the position, click the Pick Position button and click the new postion in the map window.
When the track is Enabled, it is included in the automatic search for the current location. Disabled tracks will be ignored. This allows multiple versions of the same track to exist in the config without confusing the automatic location detection system. For example you may have different versions with different sector or zone setups.
The zoom in and zoom out buttons control the default zoom level of the track map view. The zoom level is stored in the config so unless the user pans or zooms the map with the mouse, the map will recentre on the tracks central GPS position and set zoom level.
Sectors are made up of two position coordinates to create an imaginary line. When the device detects that it has crossed this line, it can output an event.
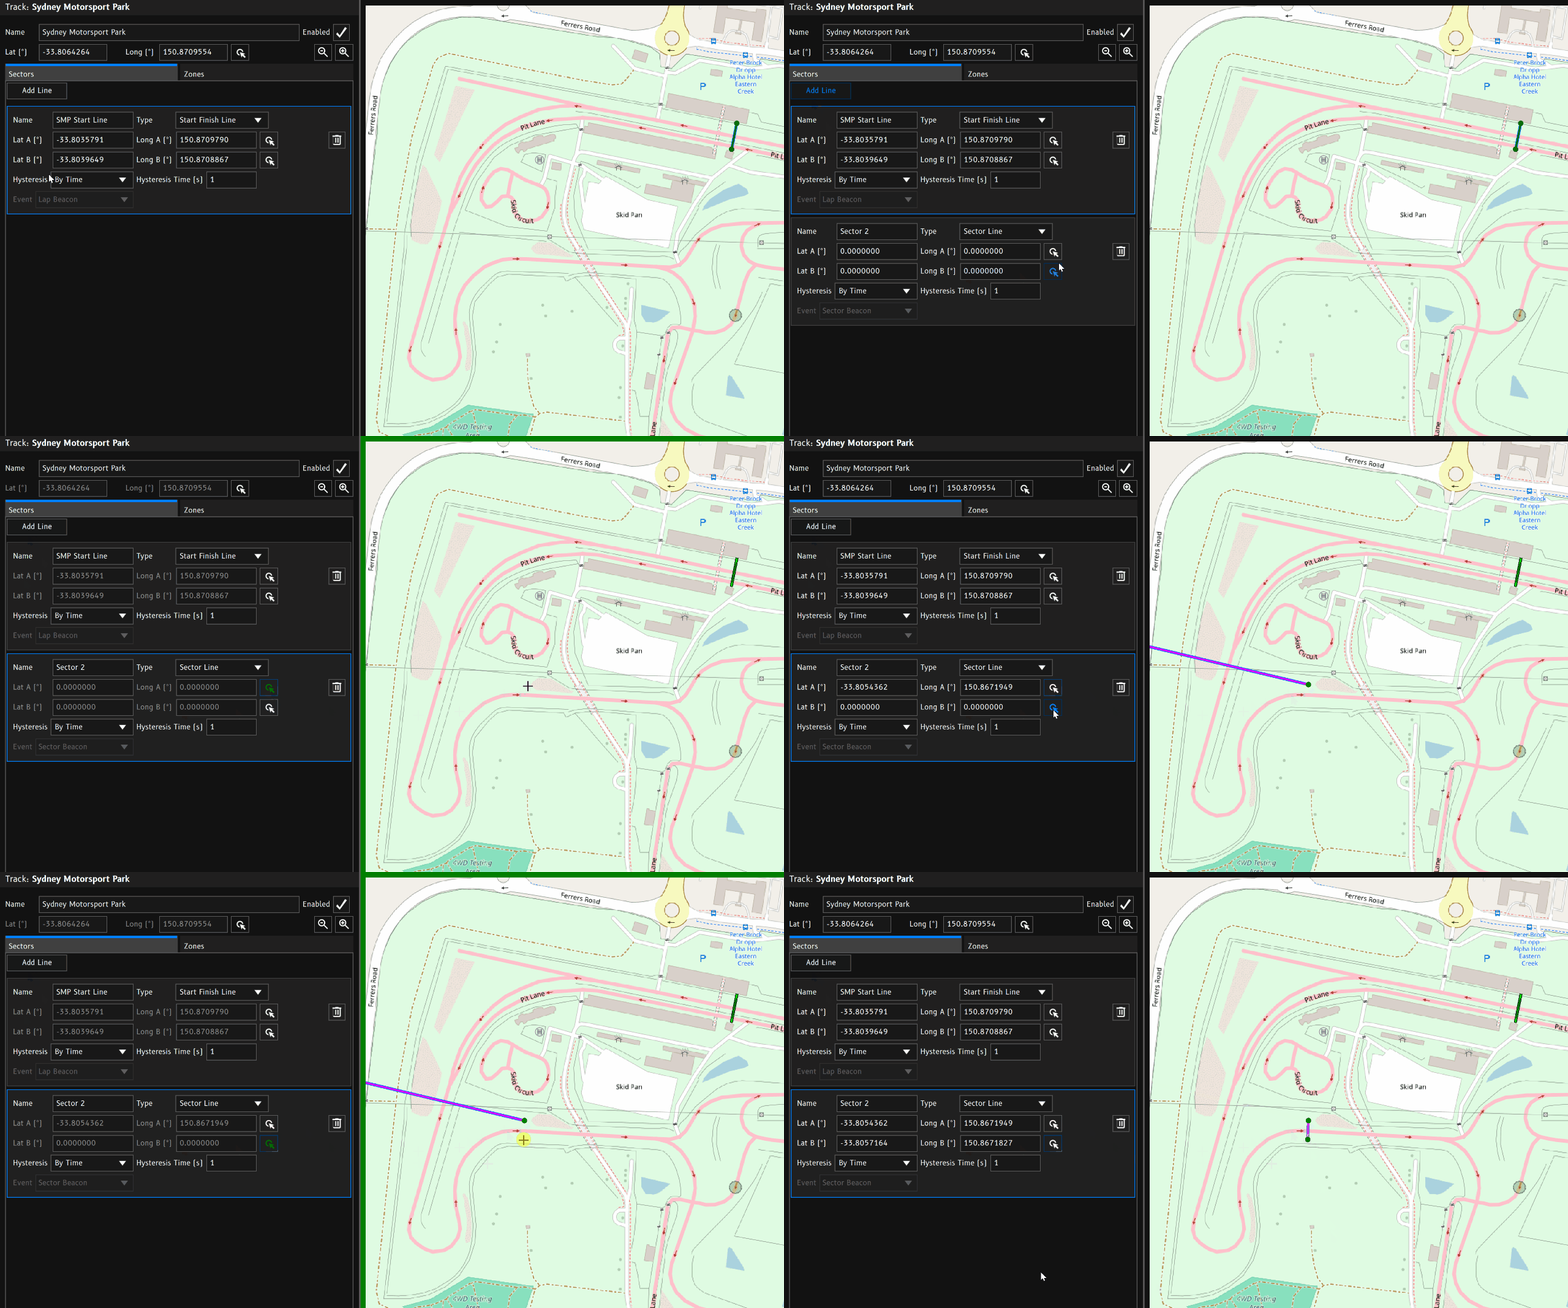
Predefined line types will output specific events:
To create a new sector line:
Add Line.Pick Position button for Lat A / Long A.Pick Position button for Lat B / Long B.Custom Line type, select the output event.There are three important events used by the Lap Timing function. Appropriate use of these beacon events will result in accurate lap timing data. Using the preset line types will handle outputting the correct event for you.
When the Lap Beacon event is triggered, the Lap Timing function will initiate the start of a new lap.
When the Sector Beacon event is triggered, the Lap Timing function will initiate the start of a new sector within the current lap.
When the Finish Beacon event is triggered, the Lap Timing function will end the current lap and wait for a new lap to start.
This is useful for point to point races or drag racing that do not have a common Start/Finish line.
Zones are polygonal areas or regions within a track or location.
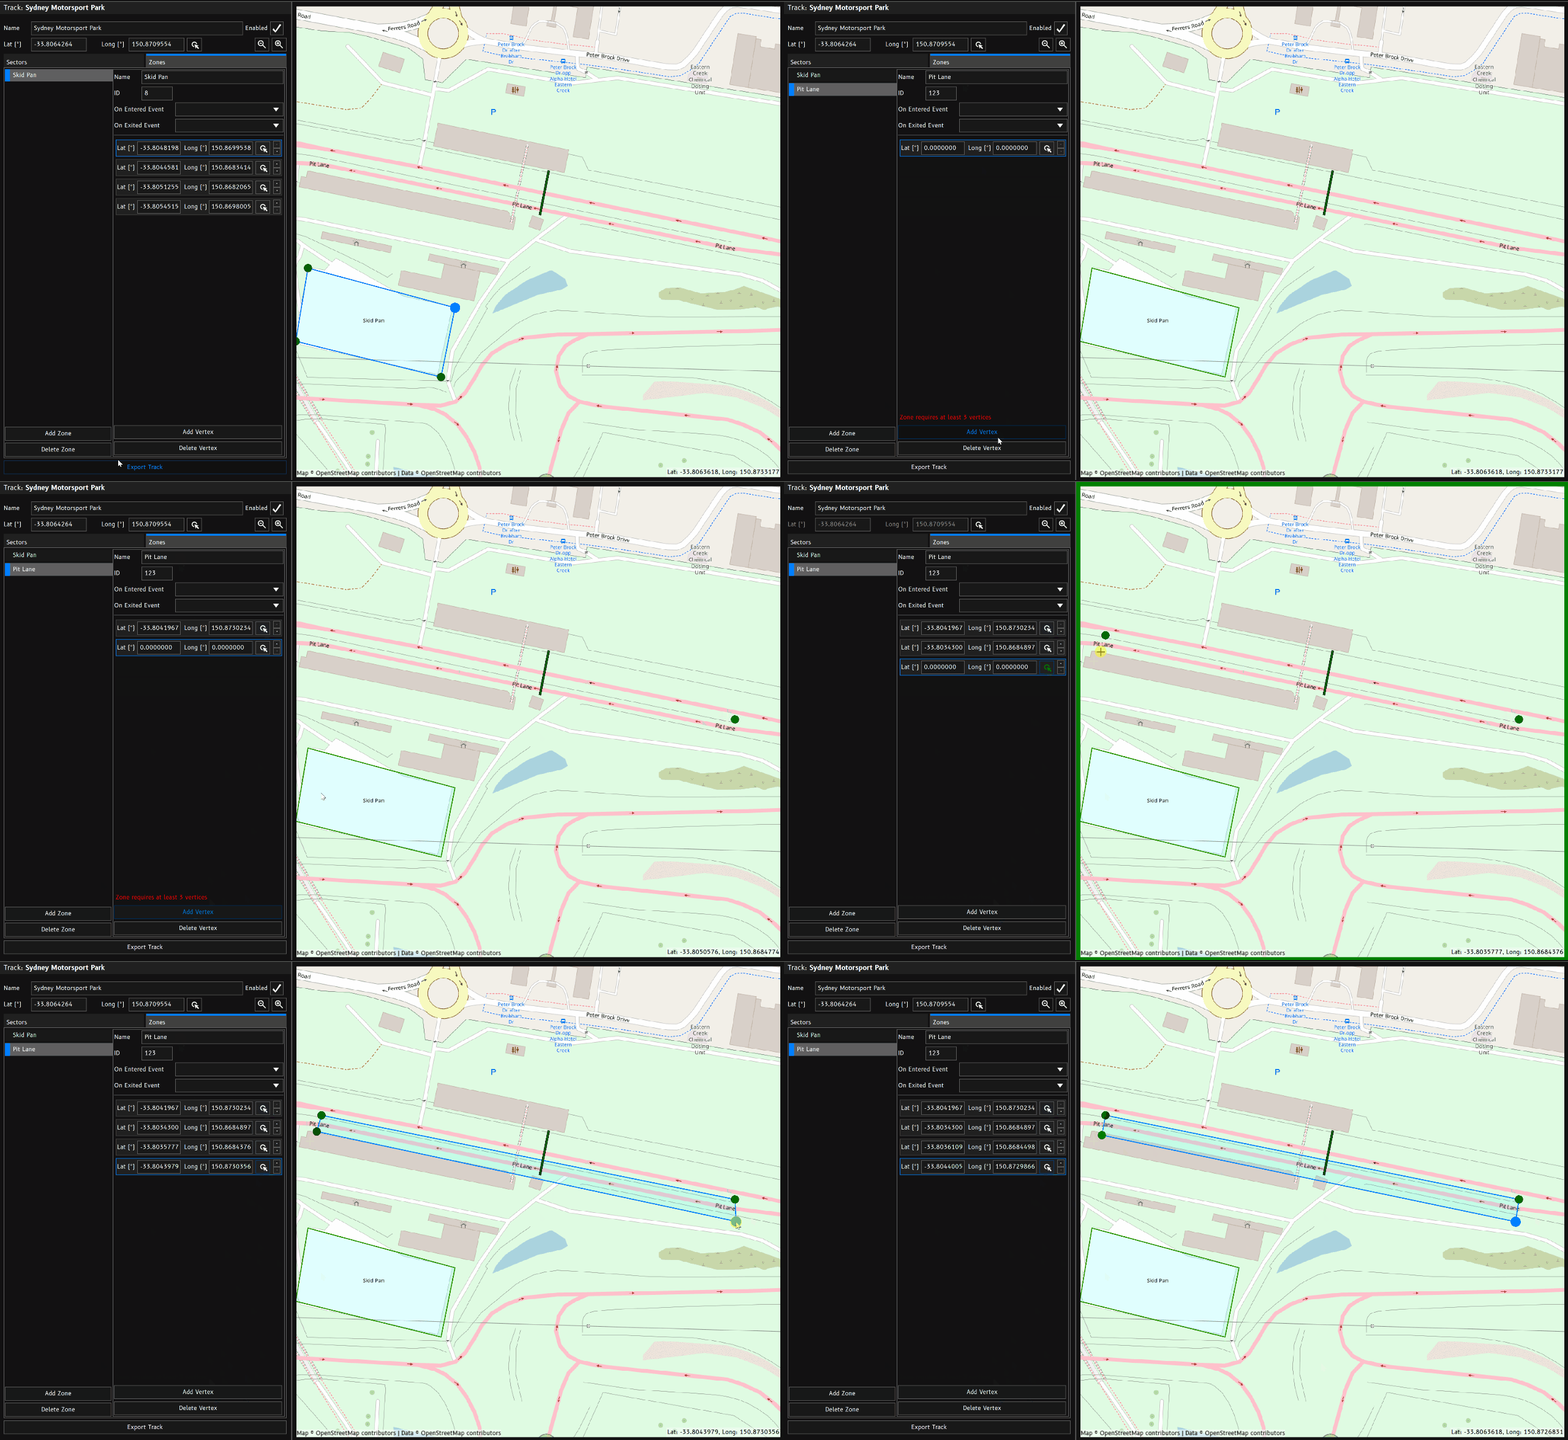
You can give each zone an ID number. This number does not have to be unique. When the device detects that it is inside a particular zone, it will output the zones ID to value to the Track Zone channel. When not inside a zone, Track Zone will revert to a value of 0. You can assign the same ID to multiple zones accross multiple tracks.
For example:
If you wish to create a common pit speed limiter, you can draw a zone around the pit lane of multiple tracks and assign them a common ID number. Inside a conditional Logic function, you can check to see if the current Track Zone value is your designated Pit Lane ID.
You may with to add additional logic checks in the event the GPS fix is poor.
Track Zone = 0.Track Zone = 4.Track Zone = 2.Track Zone = 0.Optionally, the device can trigger events of your choosing when a zone is entered and/or exited.
A zone is made up of a collection of vertices.
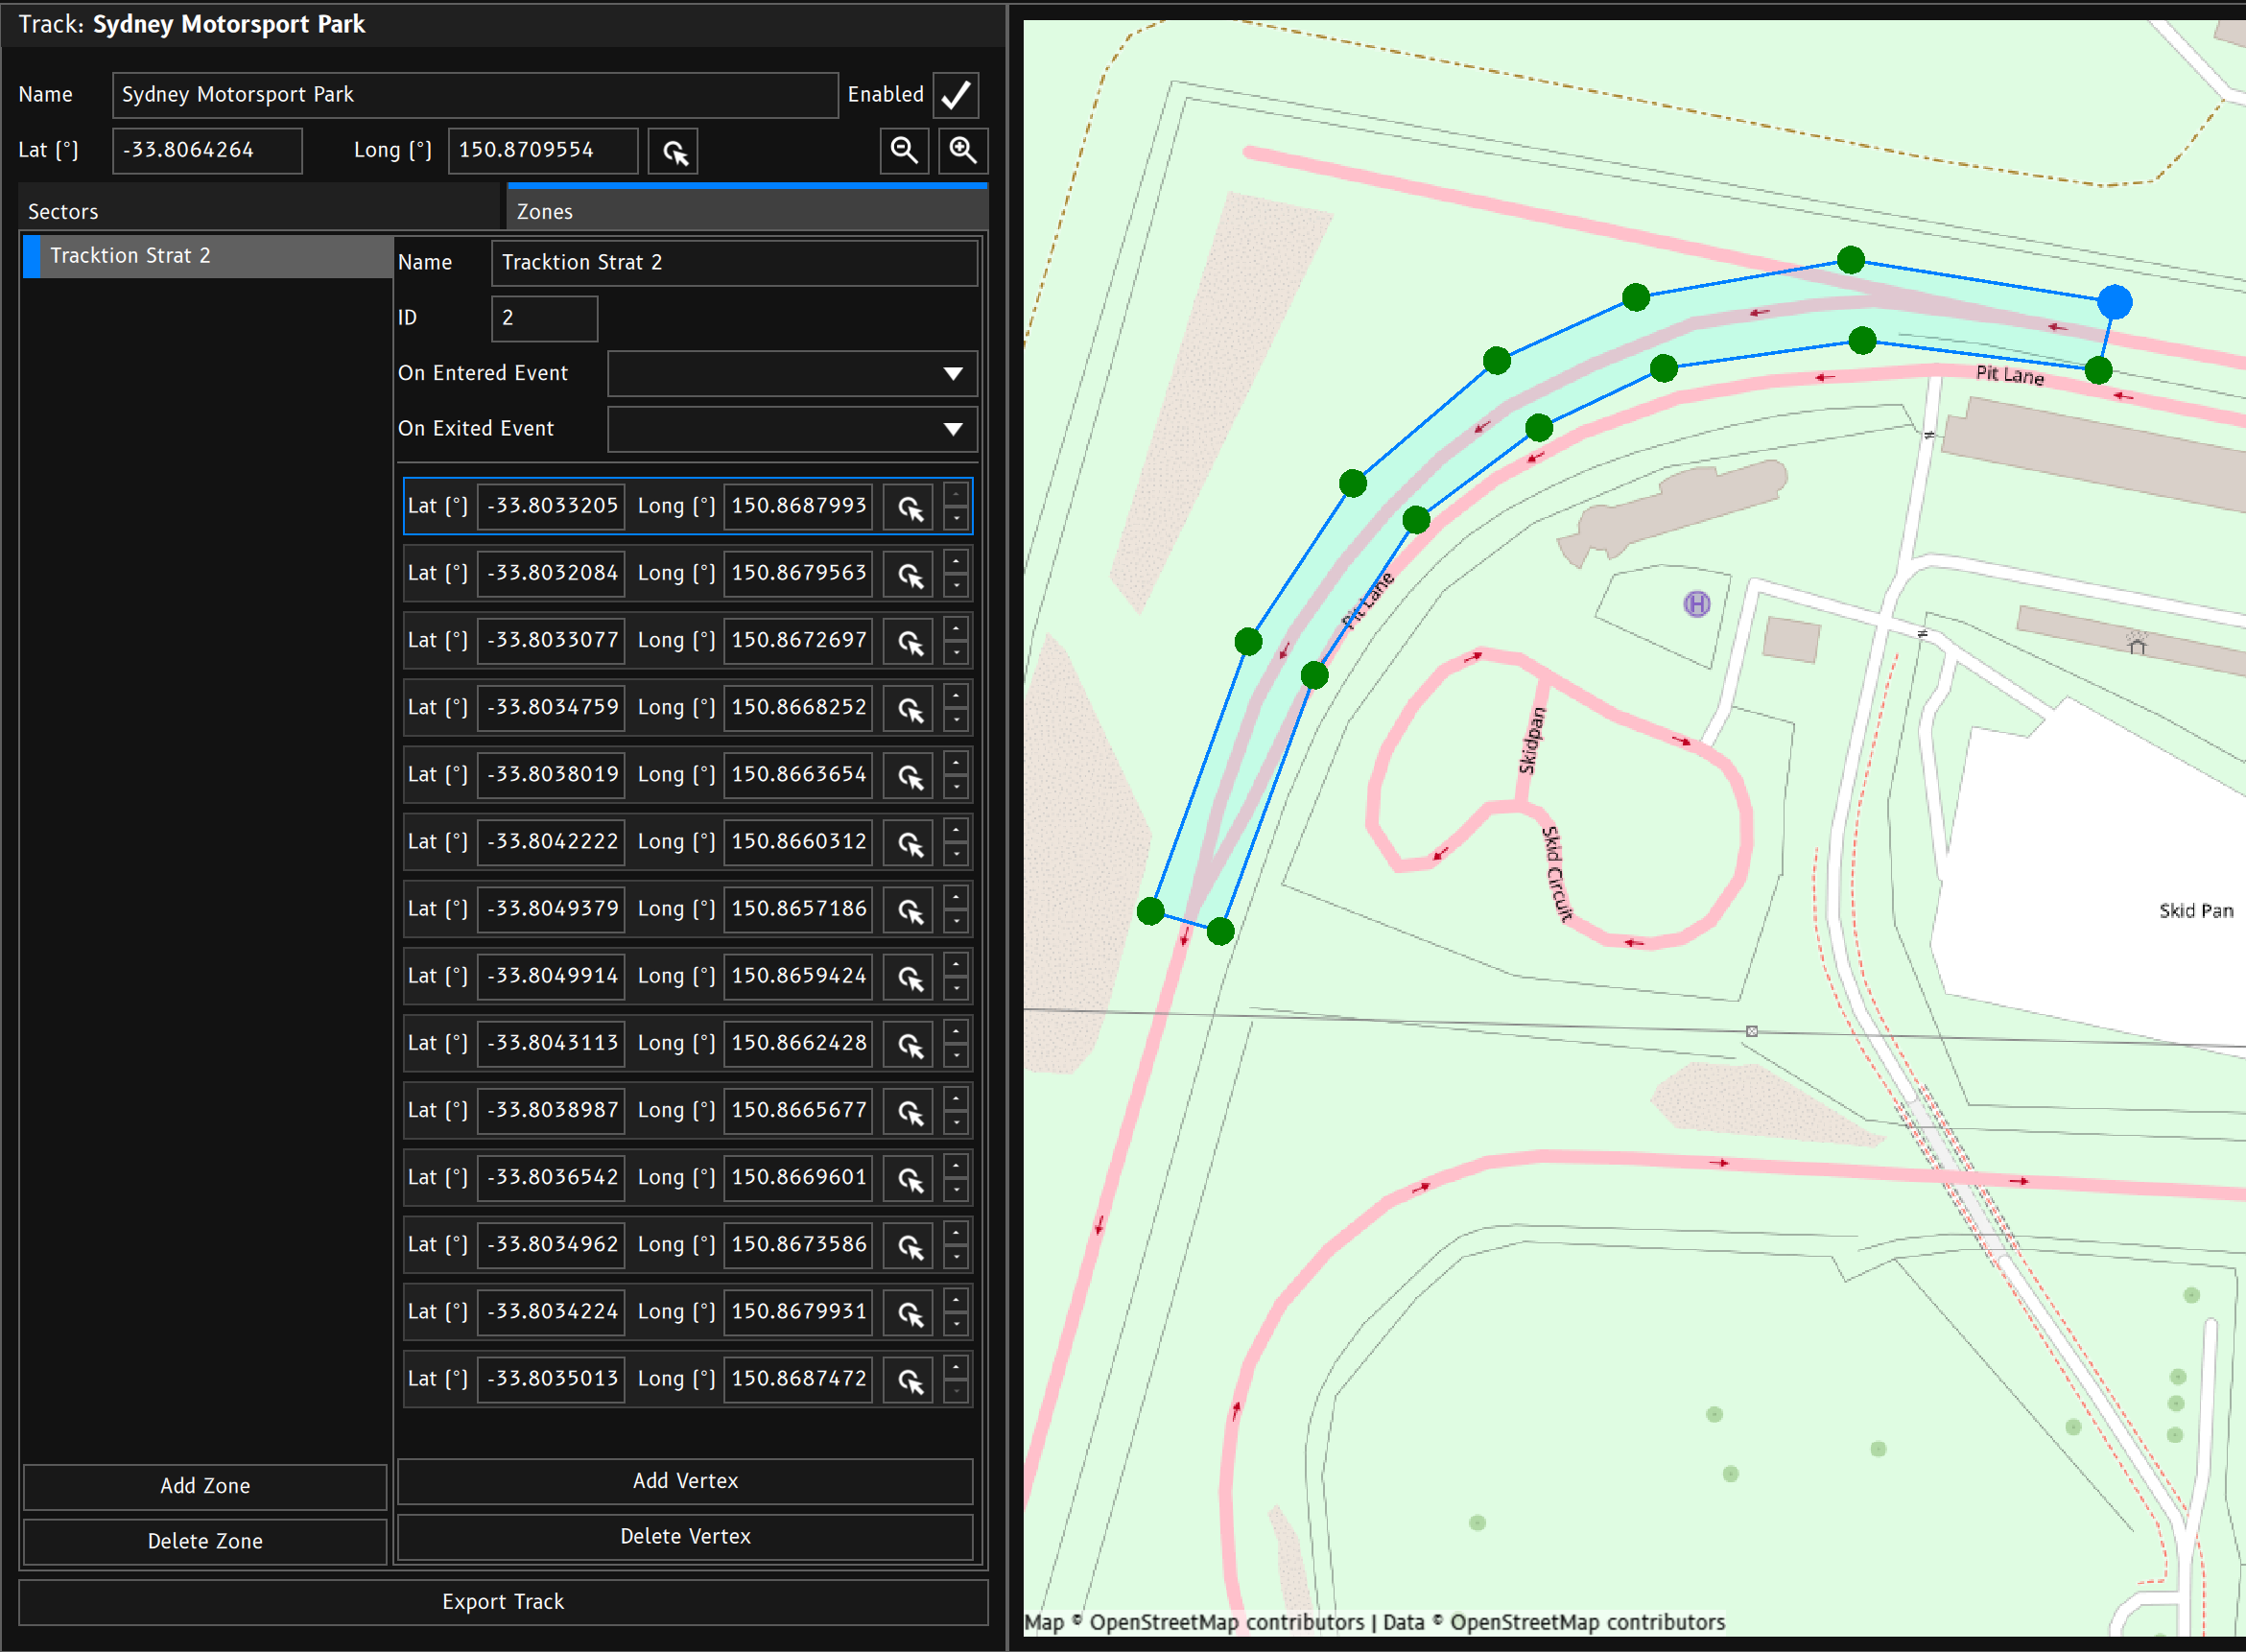
By default the ED Series Displays will broadcast the following Wi-Fi networks.
| Model | SSID | Passphrase |
|---|---|---|
| ED10M | ED10M | ed10mwifi |
| ED7M | ED7M | ed7mwifi |
| ED7 | ED7 | ed7_wifi |
The user can change the SSID and Passphrase freely.
Note: This change is stored in the device, independent of the loaded config.
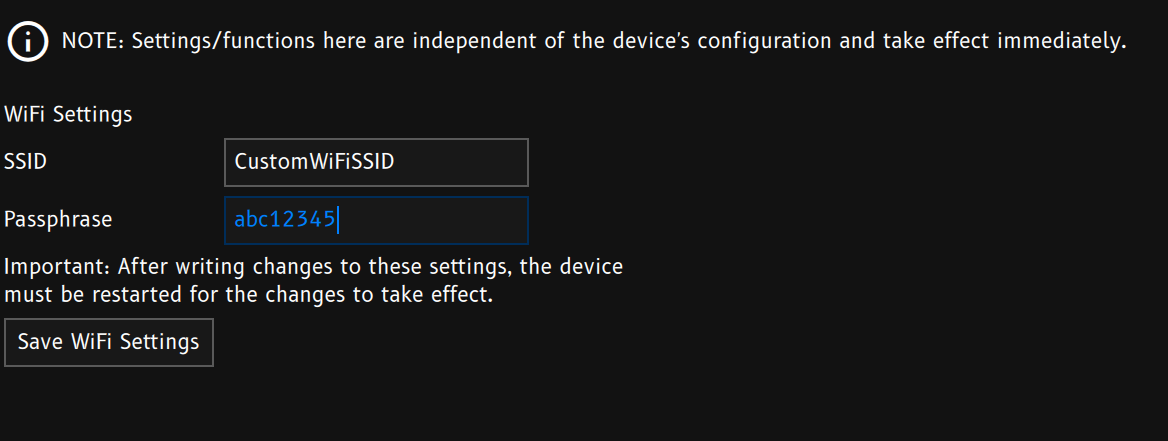
Display Studio is the PC application used to configure Emtron ED7 and ED10 series displays. It is available via EmUpdater.
Use Display Studio to build dash layouts, wire up inputs and outputs, configure timing and logging, and write the finished configuration to the display over Ethernet or Wi-Fi.
If the display is not found, work through Connection Troubleshooting.
To work offline without a connected device, use File → Open Config (or the toolbar Open button) to load a saved configuration file.
The toolbar provides quick access to common file and device operations:
| Button | Action |
|---|---|
| Open | Open a configuration file from disk |
| Save | Save the active configuration to its current path |
| Save As | Save the configuration to a new file |
| Close | Close the active configuration |
| Read from device | Download the configuration currently stored on the display |
| Write to device (F4) | Upload the active configuration to the display |
| Back / Forward | Navigate through recently visited pages |
| Sync indicator | Shows whether the loaded config matches the device |
When a device is locked, configuration read and write operations are disabled until the device is unlocked via File → Unlock Device.
The application menus mirror the configuration structure. Pages marked (device) are stored on the display hardware rather than in the configuration file.
| Item | Description |
|---|---|
| Open / Save / Save As / Close | Manage configuration files (.edconfig) |
| Read from Display | Download config from a connected display |
| Write to Display | Upload config to a connected display |
| Channel Preferences | Set display units and channel formatting — see Channel Preferences |
| Wi-Fi Setup (device) | Configure the display Wi-Fi network — see Wi-Fi |
| Bluetooth Settings (device) | Pair Bluetooth audio devices — see Bluetooth |
| Device Settings (device) | Time zone and other hardware settings — see Device Settings |
| Telemetry Credentials (device) | Authentication for telemetry services — see Telemetry |
| Language | Change the Display Studio UI language |
| Firmware Upgrade | Update display firmware — see Firmware Upgrade |
| Connection Mode | Standard or Localhost Only (for development) |
| Lock / Unlock Device | Prevent accidental config changes on the display |
| Exit | Close Display Studio |
| Item | Description |
|---|---|
| Home | Device connection status, live dash preview, and log download |
| Show Live Data (F8) | Toggle the live data drawer showing real-time channel values |
Configuration metadata and custom channel definitions — see Setup.
| Item | Page |
|---|---|
| Constants | Constants |
| User Channels | User Channels |
| User Events | User Events |
| User Enums | User Enums |
| Enum Associations | Enum Associations |
Hardware interfaces and bus configuration — see Inputs/Outputs.
| Item | Page |
|---|---|
| CAN | CAN Bus |
| RS232 | RS232 |
| RS232 Console | Serial terminal for debugging |
| LIN | LIN Bus |
| Frequency Inputs | Frequency Inputs |
| Analog Inputs | Analog Inputs |
| Virtual Inputs | Virtual Inputs |
| Cameras | Cameras |
Processing, timing, and data features — see Functions.
| Item | Page |
|---|---|
| Shift Lights | Shift Lights |
| Logging | Logging |
| Alarms | Alarms |
| Counters | Counters |
| Timers | Timers |
| Conditional Logic | Conditional Logic |
| Switch Logic | Switch Logic |
| Persistent Channels | Persistent Channels |
| PID Control | PID Controllers |
| Circuit Timing | Lap / Circuit Timing |
| Drag Timing | Drag Race Timing |
| Stage / Rally Timing | Stage Timing |
| Timing Run Library | Timing Run Library |
| Locations & lines | Track Setup |
| Fused speed | Speed Fusion |
| Math | Math Functions |
| Tables | Tables |
| Odometer | Odometer |
| IMU | IMU |
| Telemetry | Telemetry |
| Voice Comms | Voice Service |
| Text Chat | Text Service |
Dash layout and visual assets — see Display Editor.
| Item | Page |
|---|---|
| Screen Editor | Screen Editor |
| Layer Editor | Layer Editor |
| Overlay Editor | Overlay Editor |
| Navigation | Navigation |
| Images | Images |
| Fonts | Fonts |
| Media | Media |
| Brightness Control | Brightness Control |
Device and log tools — see Diagnostics.
| Item | Page |
|---|---|
| Test Functions | Test Functions |
| Live Plots | Live Plots |
| Module Control | Module Control |
| Log Replay | Log Replay |
| Upload Crash Report | Send a crash report to Emtron support |
| Download Debug File | Download diagnostic data from the display |
| Item | Description |
|---|---|
| Help for this page (F1) | Context help for the current page (in-app panel + optional browser) |
| Datasheets | Open product datasheets |
| Online Help | Open this help manual |
| Release Notes | View Display Studio release notes |
| Shortcut | Action |
|---|---|
| F1 | Toggle context help for the current page |
| F4 | Write configuration to device |
| F7 | Toggle left navigation panel |
| F8 | Toggle live data drawer |
| Alt+Left / Alt+Right | Navigate back / forward |
| Ctrl+Z | Undo |
| Ctrl+Y / Ctrl+Shift+Z | Redo |
| Escape | Open the menu bar |
A typical configuration session follows these steps:
TIP: Use the Details → All tab to search for any channel or setting across the entire configuration.
The Setup menu contains configuration metadata and user-defined channels and events. These underpin the rest of the configuration — functions, gauges, and bus mappings all reference channels and events defined here.
See Channels and Events for the underlying concepts.
Named sections of fixed channel values used by maths, gauges, and logs.
Create custom channels for project-specific data.
Create custom events for project-specific triggers.
Define text labels for numeric channel values.
Link built-in channels to enum definitions for text display.
Replaced by Setup → Constants.
Setup → Constants
Constants are fixed values published as channels on the display. Use them for car- or session-specific numbers that functions, gauges, and maths need — for example tyre circumference, gear ratios, or driver preferences — without hard-coding those values into each feature.
Constants are part of the configuration file. They are also written into every onboard log so analysis tools can use the same values that were active during the run.
Constants are organised into sections (for example Car, Driver, or Event).
Each entry picks a channel and an explicit value for that channel. Only one constant should write a given channel.
| Action | Behaviour |
|---|---|
| Export | Saves the current constants as YAML (compatible with EmVision session constants). |
| Import | Merges by section name — you can load several files (e.g. car + driver). Matching section names combine; new sections are added. |
| Replace… | Loads one file and discards the current constants set. |
Setup → User Channels
User channels let you define custom named channels for data that is not covered by the built-in channel list. They behave like any other channel — functions can read and write them, gauges can display them, and they can be logged.
User channel definitions can be exported and imported between configurations using the toolbar buttons. This is useful when sharing a common set of custom channels across multiple vehicle configs.
TIP: Prefer built-in channels where they exist. Built-in channels ensure compatibility when importing sub-configurations from other projects. Contact Emtron support to request addition of commonly needed channels.
See Channels and Events for guidance on when to use custom channels.
Setup → User Events
User events are discrete triggers — they fire at a point in time rather than holding a continuous value. Other functions listen for events to perform actions such as resetting a counter, switching a screen, or starting a log.
User events can be triggered by conditional logic, switch logic, CAN receive mappings, keypad inputs, and other functions that support event outputs.
Like user channels, event definitions can be exported and imported between configurations.
See Channels and Events for more on how events differ from channels.
Setup → User Enums
Enums map numeric values to display text. For example, a gear position channel might map 0 to “N”, 1 to “1st”, and so on. Gauges and live data views use enum labels when a channel is associated with an enum.
Enums are referenced from user channels, built-in channels (via enum associations), and status gauges on the display.
Setup → Enum Associations
Enum associations connect built-in channels to enum definitions so that numeric values display as text. This is separate from user enums — it applies to the predefined channel list that ships with the display firmware.
When the channel value is displayed in live data, logged data, or on a status gauge, the associated enum text is shown instead of the raw number.
For channels you create yourself, assign the enum directly on the User Channels page instead.
Vehicle Details has been replaced by Constants.
Use Setup → Constants to organise fixed channel values into named sections, import or export YAML, and publish those values on the device and into onboard logs.
The Inputs/Outputs menu configures how the display receives and sends data — CAN bus messages, serial ports, analog and frequency inputs, cameras, and more.
Each input writes to a channel. Each output reads from a channel or triggers an event. See Channels and Events for how data flows between inputs, functions, and outputs.
Configure CAN bus ports, termination, and message mapping.
Configure the RS232 serial port.
Configure wheel speed and RPM frequency inputs.
Configure voltage, resistance, and digital analog inputs.
Process and calibrate channel values with filtering.
Configure camera inputs for the display.
Inputs/Outputs → CAN
The ED7 and ED10 displays support multiple CAN bus ports. Each bus can be configured independently for baud rate, termination, and message routing.
Each CAN tab (CAN 1, CAN 2, etc.) provides:
| Setting | Description |
|---|---|
| Baud Rate | Bus speed — typically 500 kbit/s or 1 Mbit/s |
| Termination | Enable the onboard 120 Ω termination resistor when this device is at the end of the bus |
| Mode | Normal operation or diagnostic listen mode |
Use the Comms Options panel to enable CAN diagnostic streaming, which shows raw bus traffic when a device is connected.
CAN receive entries map incoming CAN frames to channels or events:
Multiple receive definitions can exist on each bus. Emtron ECUs typically transmit on standard Emtron CAN IDs — the display ships with default receive templates for Emtron Display Tx Set 1 and Set 2.
CAN transmit entries send channel values on the bus at a configured rate:
OBD-II scanning is configured as a CAN client on one of the bus ports. See the OBD-II guide for full setup and PID configuration.
Refer to the ED10M or ED7M datasheet pinout for CAN wiring connections.
Inputs/Outputs → RS232
The display RS232 port supports serial communication with external devices such as GPS modules, lap timing systems, or custom peripherals.
| Setting | Description |
|---|---|
| Mode | Operating mode for the serial port |
| Baud Rate | Communication speed |
| Protocol | Data framing and parsing protocol |
Configure receive mappings to write incoming serial data to channels, and transmit mappings to send channel values out on the serial port.
Inputs/Outputs → RS232 Console
The serial console provides a terminal view of raw RS232 traffic when a display is connected. Use it to verify that an external device is communicating correctly and to debug protocol issues.
Inputs/Outputs → Frequency Inputs
Frequency inputs read pulse signals from speed sensors, RPM pickups, and similar sources. Each input converts pulse frequency into a channel value such as wheel speed or engine RPM.
Select a frequency channel from the list, then configure:
| Setting | Description |
|---|---|
| Output Channel | The channel that receives the calculated value |
| Pulses Per Revolution | Number of pulses per wheel or shaft revolution |
| Digital Input | Optional digital input for direction or validity |
| Filter | Signal filtering options |
The hardware type of each input determines which pins on the display connector are used. Refer to the product datasheet for pin assignments.
Wheel speed sensors on the rear axle might be configured as two frequency inputs — one for left rear and one for right rear. These channels can then feed Speed Fusion, Math Functions, or CAN transmit messages.
Inputs/Outputs → Analog Inputs
Analog inputs read voltage or resistance signals from sensors such as pressure transducers, temperature senders, and potentiometers.
Each analog channel supports one of three types:
| Type | Use Case |
|---|---|
| Voltage | 0–5 V sensors, MAP sensors, TPS |
| Resistance | NTC temperature sensors, resistance-based senders |
| Digital | Switched inputs read as on/off |
Depending on the physical input, additional hardware options may be available:
| Option | Description |
|---|---|
| Internal Pull-up | Enable the onboard pull-up resistor for resistance measurements |
| Extended Range | Use the extended voltage divider for signals above 5 V |
Resistance and voltage inputs support calibration tables to convert the raw reading into engineering units. Configure the calibration curve to match your sensor’s characteristics.
Assign each configured input to an Output Channel so that functions, gauges, and logging can use the sensor value.
Inputs/Outputs → Virtual Inputs
Virtual inputs take an existing channel value, optionally filter and calibrate it, and write the result to a new output channel. They do not read from physical hardware directly.
For each virtual input:
| Setting | Description |
|---|---|
| Input Channel | Source channel to read |
| Output Channel | Destination channel to write |
| Filter | Optional moving-average filter |
| Calibration Table | Optional lookup table to scale or convert the input |
Note: Only one function should write to a given output channel. Do not assign the same output channel to multiple virtual inputs or other output functions.
Inputs/Outputs → Cameras
ED10M displays support multiple camera inputs for rear-view and auxiliary video feeds. Camera video is displayed using the Camera Gauge on a screen.
| Setting | Description |
|---|---|
| Power-On Input | Which camera input is shown when the display starts |
To switch between camera inputs at runtime, trigger one of the built-in camera selection events:
These events can be sent from conditional logic, keypad mappings, or the Test Functions diagnostics page. The Cameras page includes test buttons to verify each input when a display is connected.
Add a Camera Gauge to a screen in the Screen Editor. The gauge fills its area with the live feed from the currently selected camera input. Flip options on the gauge correct inverted camera mounting.
The Display menu is where you design what appears on the dash. Screens hold gauges and widgets; layers provide sub-views within a screen; overlays float above the main content.
For detailed gauge type reference, see Gauges.
Create and edit dash screens with gauges and widgets.
Create reusable gauge layers for layer group gauges.
Configure gauges that appear above all screens.
Configure screen switching and the startup screen.
Manage image assets used by gauges.
Manage custom fonts for text and value gauges.
Manage audio and video media files.
Configure automatic and manual display brightness.
Display → Screen Editor
The Screen Editor is the primary layout tool. Each tab represents one screen (page) on the dash. Screens contain gauges positioned at specific coordinates on the display.
.edscreen files to share between configs.Toggle Edit Statics to switch between dynamic screens (updated every frame) and static screens (rendered once for performance).
Use the zoom slider to adjust the editor zoom level. The preview shows a live render when a device is connected.
All gauge types are documented in the Gauges reference. Common choices:
| Gauge | Purpose |
|---|---|
| Value | Numeric channel display |
| Dial | Rotating needle on an image |
| Bar | Horizontal or vertical fill indicator |
| Text | Static labels and titles |
| Status | Text with coloured background per value |
| Layer Group | Container that switches between sub-layers |
| Camera | Live video feed |
Set Test Value on a gauge to preview how it looks with a specific channel value without needing live data. When connected, the preview updates with real channel values automatically.
Display → Layer Editor
Layers are self-contained gauge layouts that can be embedded in a screen via the Layer Group Gauge. Each layer is an independent set of gauges rendered to an off-screen texture.
.edlayer files.Layers are edited the same way as screens — add gauges, position them, and configure properties. The layer dimensions define the render area.
Layer switching is event-driven, making layers suitable for multi-page dashboards, context-sensitive views, and menu systems.
Display → Overlay Editor
Overlays are gauge layouts rendered on top of every screen. They are useful for elements that should always be visible — shift lights, warning indicators, alarm banners, or a persistent speed readout.
Overlays are edited like screens and layers:
Because overlays render above the active screen, use a high Z Layer value on overlay gauges to ensure they appear in front of screen content.
Display → Navigation
Navigation settings control how the driver moves between screens and which screen appears at startup.
| Setting | Description |
|---|---|
| Starting Screen | The screen shown when the display powers on |
| Next Screen Event | Event that advances to the next screen |
| Previous Screen Event | Event that goes to the previous screen |
| Wrap | When enabled, navigating past the last screen returns to the first |
Map physical buttons or CAN keypad inputs to the next/previous screen events. For example:
Layer groups within a screen have their own independent next/previous layer events, configured on the Layer Group Gauge itself.
Display → Images
The Images page manages PNG image files embedded in the configuration. Gauges such as Dial, Image, Multi Image, and Cropped Image reference files from this library.
Images are referenced by filename in gauge properties (for example, File Name on a Dial Gauge). Use PNG format with transparency for best results.
Display → Fonts
Custom fonts can be embedded in the configuration for use by Text, Value, Time, and Status gauges.
Assign a font to a gauge via its Font property. Leave empty to use the default system font.
Display → Media
The Media page manages audio and video files embedded in the configuration. Media assets can be played by display functions or triggered by events.
Supported formats depend on the display firmware. Refer to Display Release Notes for current format support.
Display → Brightness Control
Brightness control adjusts the LCD and LED backlight intensity based on manual settings, a control channel, or ambient conditions.
| Mode | Behaviour |
|---|---|
| Single Brightness | Fixed brightness percentage (0–100) |
| Dual Brightness | Two brightness levels selected by a control channel — value 0 uses low brightness, any other value uses high brightness |
| Table | Brightness mapped from a channel value via a lookup table |
| Auto | Automatic brightness based on configured rules |
When a headlight-dim input is wired on the display connector, brightness can drop automatically for night driving. Combine headlight dimming with dual brightness mode for day/night profiles.
Shift light LED brightness is configured separately on the Shift Lights page.
Some settings are stored on the display hardware rather than in the configuration file. These persist across config changes and are accessed from the File menu in Display Studio.
Set display units and formatting for channels.
Hardware settings stored on the display.
Update display firmware.
Pair Bluetooth audio devices with the display.
File → Channel Preferences
Channel preferences control how channel values are displayed — unit conversions, decimal places, and formatting. Preferences are applied per application or device, not stored in the configuration file.
Channels are stored and logged in their base metric units internally. Preferences only affect display — configuration files and log files remain unit-agnostic. This allows configs and logs to be shared across regions, with each user viewing data in their preferred units.
| Button | Description |
|---|---|
| Write to Device | Save preferences to the connected display |
| Read from Device | Load preferences from the connected display |
| Save to File | Export preferences as an .epref file |
| Load from File | Import preferences from an .epref file |
Configure individual channel display units and precision in the preferences table below the action buttons.
File → Device Settings
Device settings are stored on the display hardware and persist independently of the loaded configuration.
Select the display time zone from the dropdown. This affects timestamps on logged data and any time displays on the dash.
Changes take effect immediately on the connected device.
File → Firmware Upgrade
Firmware upgrades update the display operating system and runtime. A firmware update is required before loading configurations that use features introduced in newer firmware versions.
Do not power off the display during a firmware upgrade. The upgrade dialog shows progress and will report when complete.
Firmware files are also available from EmUpdater. See Display Release Notes for version history.
File → Bluetooth Settings
Bluetooth settings are stored on the display hardware. Use this page to pair phones or other devices for audio playback through the display speakers.
Enable Act as Bluetooth Speaker (A2DP Sink) to allow the display to receive audio from a paired phone or tablet. This is commonly used for telemetry voice alerts or music playback through the dash speakers.
Bluetooth settings persist across configuration changes and power cycles.
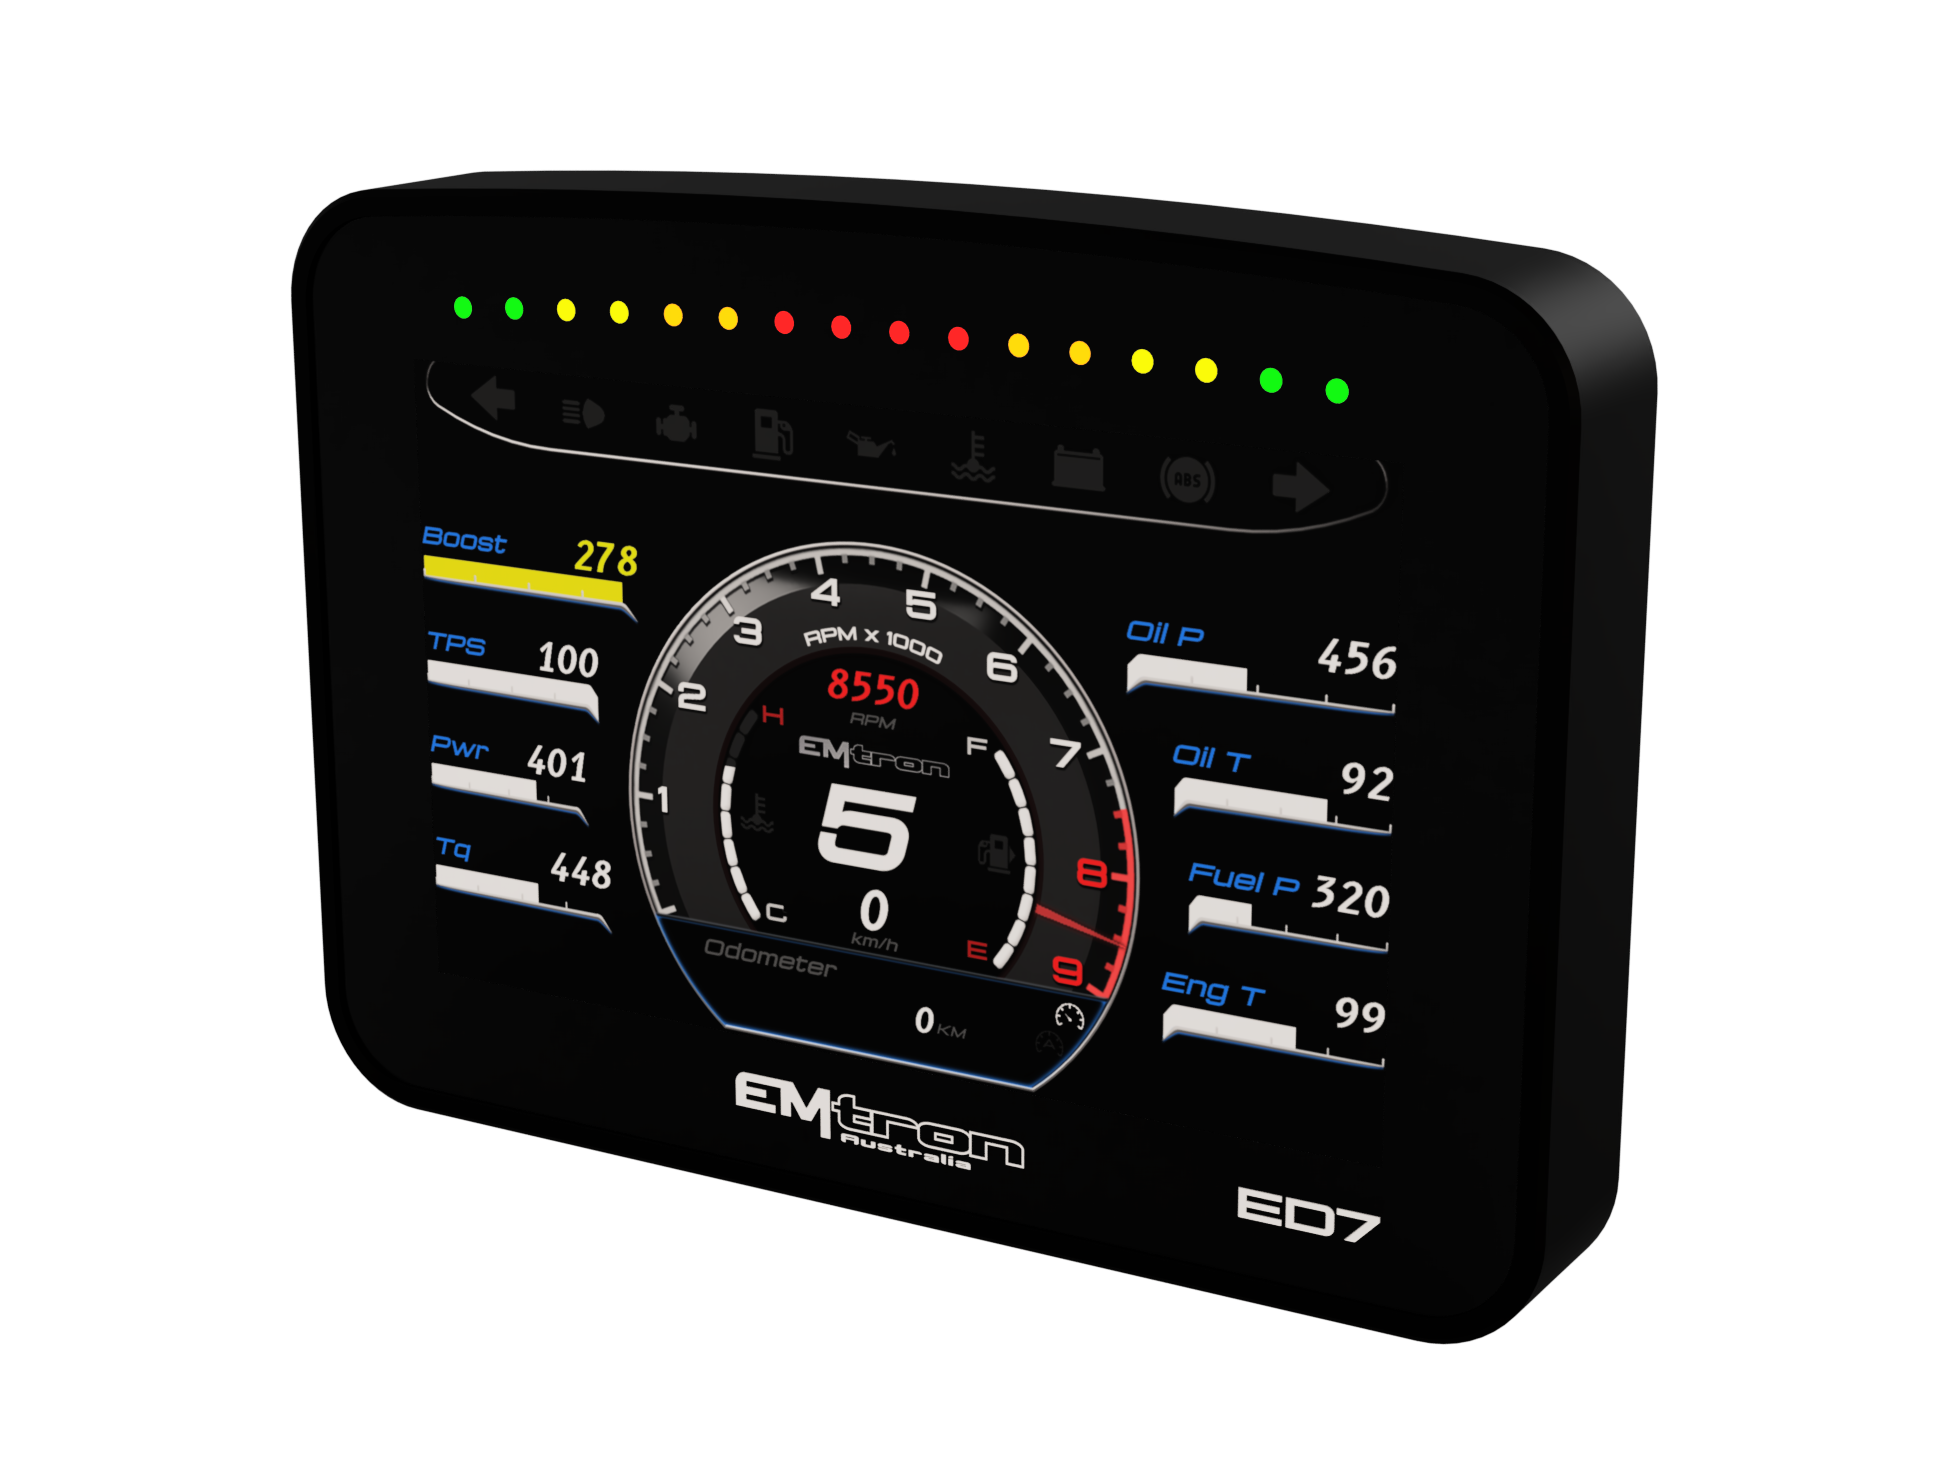
6x Analog Voltage
4x Frequency Inputs
Full In-field firmware updatable over Ethernet using the Emtron Display Setup Tool
Connector Superseal 34-Way KEY 1
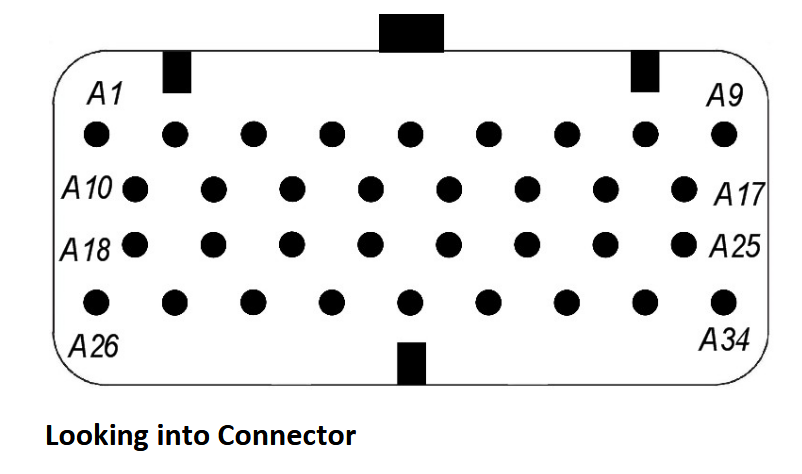
| Pin | Channel Name | Pin | Channel Name |
|---|---|---|---|
| 1 | 14V Switched Supply | 18 | Gigabit Ethernet +Tx/Rx Pair 1 |
| 2 | 14V Backup Supply | 19 | Gigabit Ethernet -Tx/Rx Pair 1 |
| 3 | Sensor Supply: 5.0V | 20 | Gigabit Ethernet -Tx/Rx Pair 3 |
| 4 | Analog Input Channel 1 | 21 | Gigabit Ethernet +Tx/Rx Pair 3 |
| 5 | Analog Input Channel 2 | 22 | Speed Input 1 |
| 6 | Analog Input Channel 3 | 23 | Speed Input 2 |
| 7 | Analog Input Channel 4 | 24 | Speed Input 3 |
| 8 | Analog Input Channel 5 | 25 | Speed Input 4 |
| 9 | Analog Input Channel 6 | 26 | Gigabit Ethernet +Tx/Rx Pair 2 |
| 10 | 12V Regulated Output 2 | 27 | Gigabit Ethernet -Tx/Rx Pair 2 |
| 11 | RS232 Transmit Output | 28 | Gigabit Ethernet +Tx/Rx Pair 4 |
| 12 | RS232 Receive Input | 29 | Gigabit Ethernet -Tx/Rx Pair 4 |
| 13 | 0V Reference OUT | 30 | CAN 1 High |
| 14 | Analog Input 0V Reference | 31 | CAN 1 Low |
| 15 | Video 0V Reference | 32 | CAN 2 High |
| 16 | Video Input 1 | 33 | CAN 2 Low |
| 17 | Video Input 2 | 34 | Ground |
| Pin | Channel Name |
|---|---|
| 1 | 14V Supply + |
| 34 | Ground - |
| 2 | 14V Backup Supply + |
| Pin | Channel Name |
|---|---|
| 3 | Sensor Supply 5V |
| 14 | Sensor 0V Reference |
| Emtron Pin | RJ45 Pin T-568A | Description | Cat5e Wire Colour |
|---|---|---|---|
| 18 | 1 | Ethernet Tx/Rx + Pair 1 | Green/White |
| 19 | 2 | Ethernet Tx/Rx - Pair 1 | Green |
| 26 | 3 | Ethernet Tx/Rx + Pair 2 | Orange/White |
| 27 | 6 | Ethernet Tx/Rx - Pair 2 | Orange |
| 20 | 4 | Ethernet Tx/Rx + Pair 3 | Blue |
| 21 | 5 | Ethernet Tx/Rx - Pair 3 | Blue/White |
| 28 | 7 | Ethernet Tx/Rx + Pair 4 | Brown/White |
| 29 | 8 | Ethernet Tx/Rx - Pair 4 | Brown |
NOTE: The Orange/White and Brown/White can often look very similar in colour so make sure the correct wire is used
| Pin | Channel Name |
|---|---|
| 30 | CAN 1 High |
| 31 | CAN 1 Low |
| 32 | CAN 2 High |
| 33 | CAN 2 Low |
| Pin | Channel Name |
|---|---|
| 11 | RS232 Transmit Output |
| 12 | RS232 Receive Input |
| 13 | 0V Reference Out |
| Pin | Channel Name | Voltage Range |
|---|---|---|
| 4 | Analog Input Channel 1 | 0 – 5.0V |
| 5 | Analog Input Channel 2 | 0 – 5.0V |
| 6 | Analog Input Channel 3 | 0 – 5.0V |
| 7 | Analog Input Channel 4 | 0 – 5.0V |
| 8 | Analog Input Channel 5 | 0 – 5.0V or 0 – 16.0V |
| 9 | Analog Input Channel 6 | 0 – 5.0V or 0 – 16.0V |
| 14 | Analog Input 0V Reference |
NOTE: ANV 5-6 pins have selectable input ranges; 0 – 5.0V or 0 – 16.0V
| Pin | Channel Name |
|---|---|
| 22 | Speed Input 1 |
| 23 | Speed Input 2 |
| 24 | Speed Input 3 |
| 25 | Speed Input 4 |
| 13 | 0V Reference Out (if required) |
| Pin | Channel Name |
|---|---|
| 16 | Video Input 1 |
| 17 | Video Input 2 |
| 15 | Video 0V Reference |
This is a switched 14V supply. Constant power should not be supplied on this pin.
A Constant 14V supply should be wired to this pin. When the power is removed from pin “14V Switched Supply” the ED10M automatically switches to the " 14V Backup Supply” to keep itself powered. This will allow the ED10M to complete critical tasks before shutting itself down (for example data logging storage).
NOTE: When the “14V Backup Supply” is wired to the ED10M, no additional current is drawn when the device is OFF.
As the name indicates these should be connected directly to the 0V (Ground) pin on any low current analog sensor, for example Pressure or Temperature.
This is a dedicated 0V reference for the microphone.
WarningDo not share this pinVideo inputs are multiplexed, only one input can be captured at a time.
Pin 11 is the ED7 RS232 Transmit Output. As the name suggests this is an Output and should be connected to the Receive Input of the wired external device.
Pin 12 is the ED7 RS232 Receive Input. As the name suggests this is an Input and should be connected to the Transmit Output of the wired external device.
This is the wiring standard when working with RS232 communications.
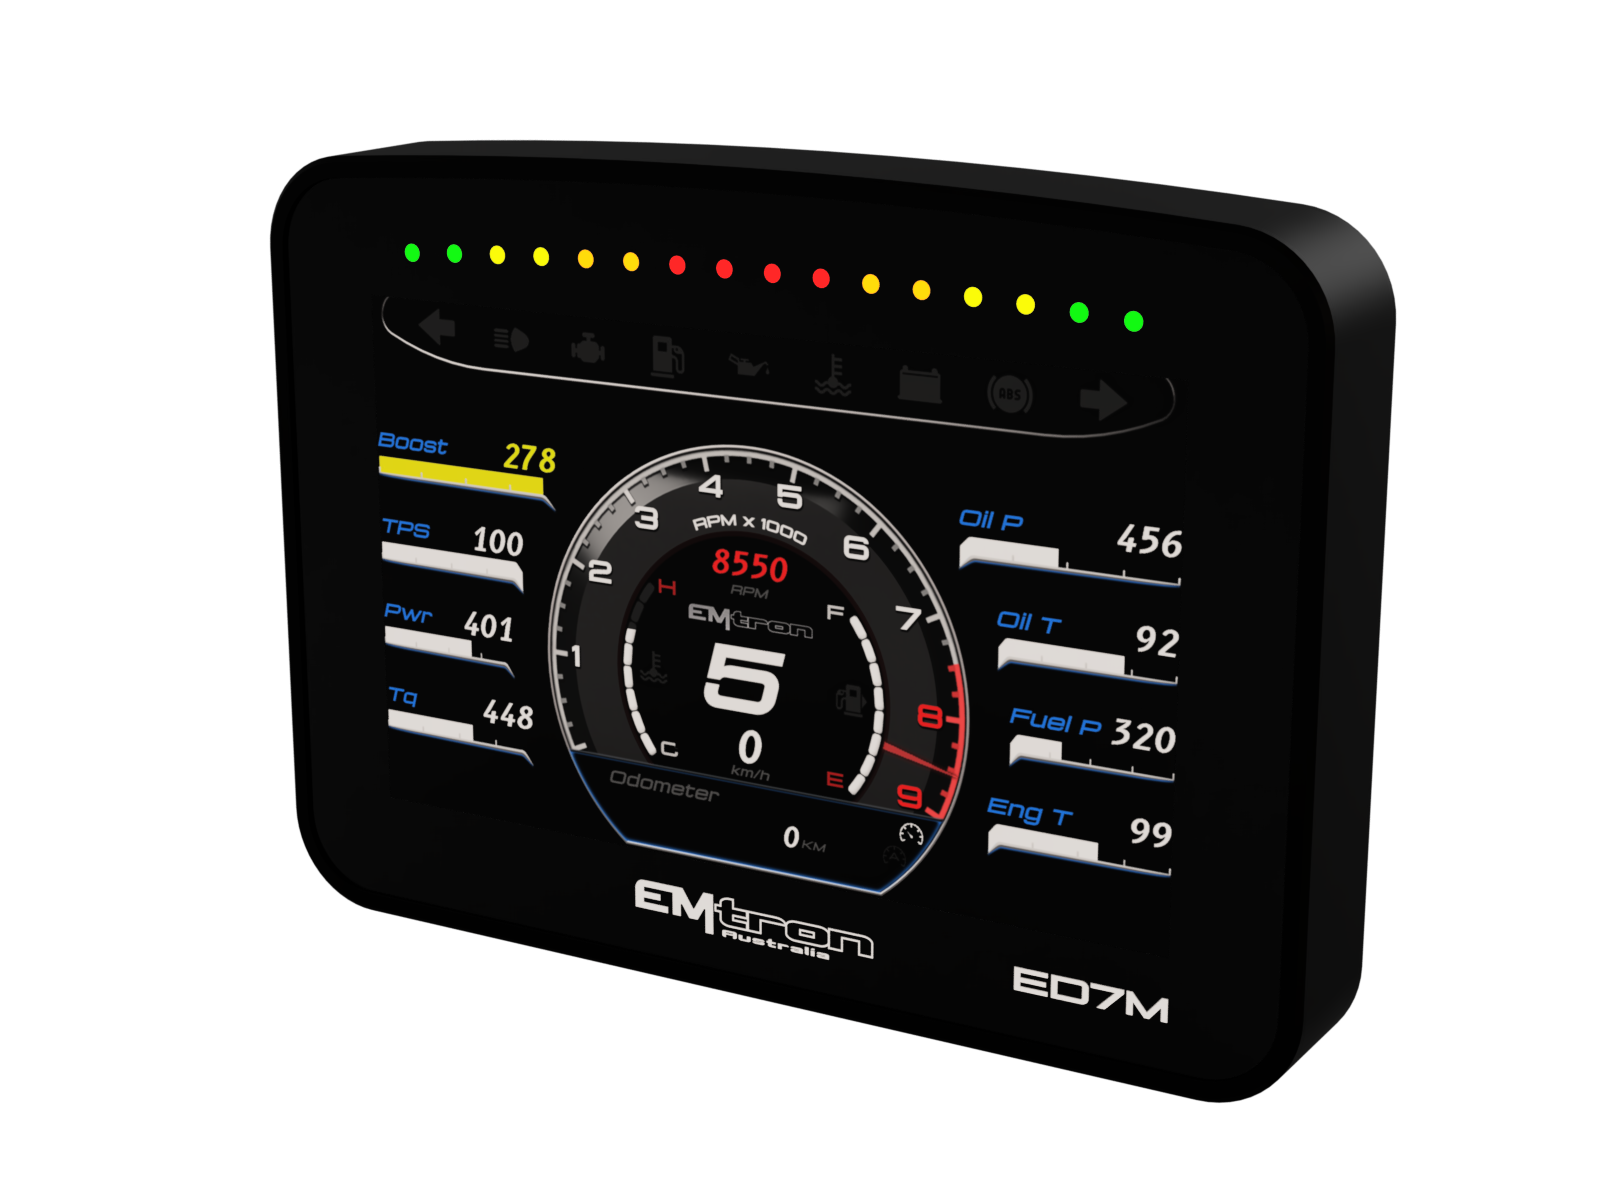
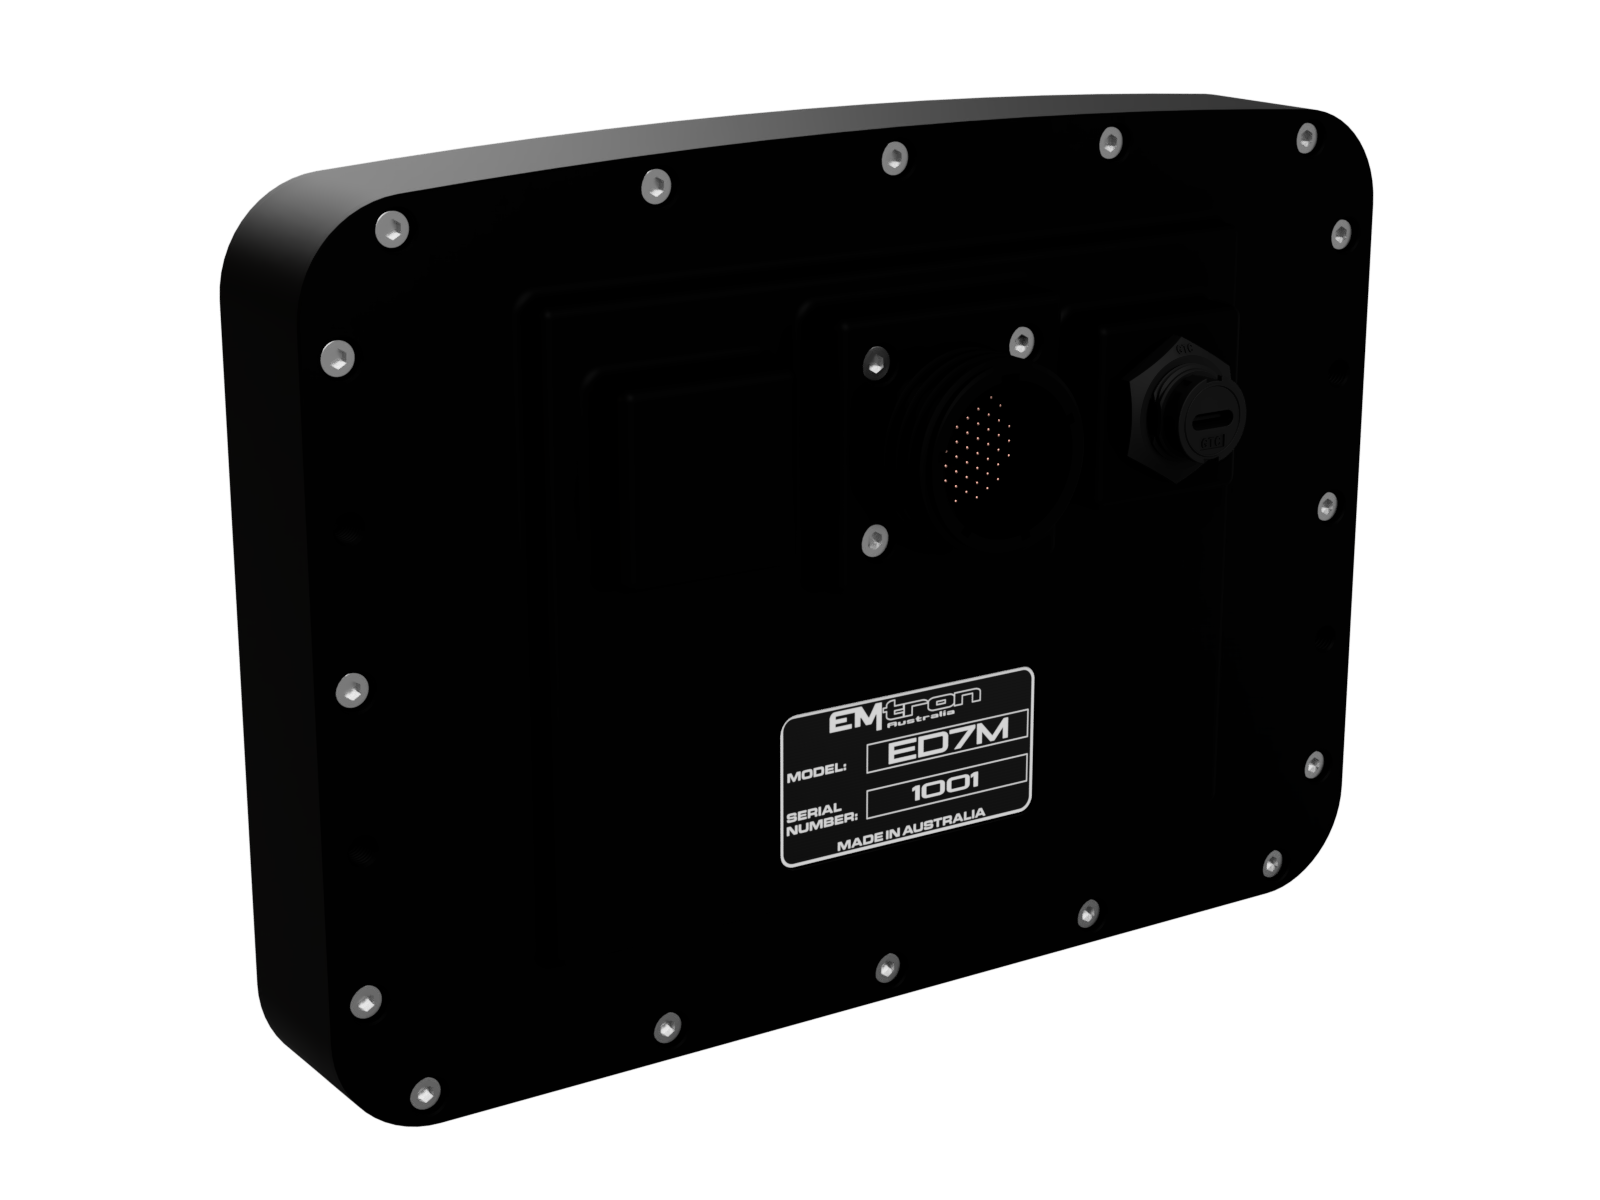
8x Analog Voltage
4x Frequency Inputs
Full In-field firmware updatable over Ethernet using the Emtron Display Setup Tool
Connector 8D0C17Z35PN: (5.0A continuous current. Shell size 17, 55 Pin. 22 AWG)
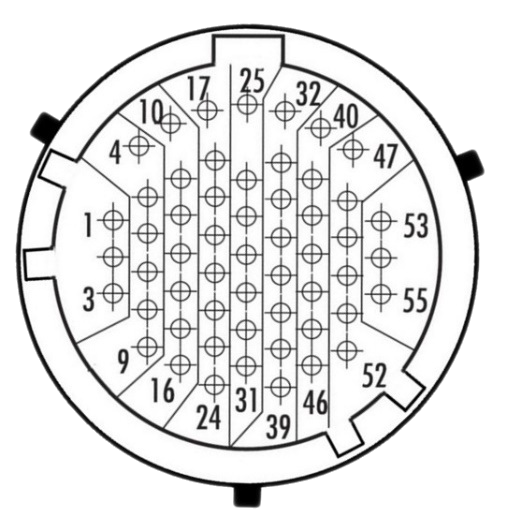
Looking into Connector
Mating Connector 8DA5-17Z35SN
| Pin | Channel Name | Pin | Channel Name |
|---|---|---|---|
| 1 | 14V Switched Supply | 29 | CAN 3 Low |
| 2 | Ground | 30 | CAN 4 High |
| 3 | Gigabit Ethernet Shield | 31 | CAN 4 Low |
| 4 | 12V Regulated Output | 32 | Analog Input Channel 5 |
| 5 | 14V Backup Supply | 33 | Analog Input Channel 6 |
| 6 | Gigabit Ethernet +Tx/Rx Pair 1 | 34 | Analog Input Channel 7 |
| 7 | Gigabit Ethernet -Tx/Rx Pair 1 | 35 | Analog Input Channel 8 |
| 8 | Gigabit Ethernet +Tx/Rx Pair 3 | 36 | Headphone LH |
| 9 | Gigabit Ethernet -Tx/Rx Pair 3 | 37 | Headphone RH |
| 10 | Sensor Supply: 5.0V | 38 | Mic Input LH |
| 11 | Sensor Supply: 5.0V | 39 | Mic Input RH |
| 12 | Sensor Supply: 5.0V | 40 | RS232 Transmit Output |
| 13 | Gigabit Ethernet +Tx/Rx Pair 2 | 41 | RS232 Receive Input |
| 14 | Gigabit Ethernet -Tx/Rx Pair 2 | 42 | RS232 0V Reference |
| 15 | Gigabit Ethernet +Tx/Rx Pair 4 | 43 | Video Input 1 |
| 16 | Gigabit Ethernet -Tx/Rx Pair 4 | 44 | Video Input 2 |
| 17 | Analog Input Channel 1 | 45 | Video Input 3 |
| 18 | Analog Input Channel 2 | 46 | Mic 0V Reference |
| 19 | Analog Input Channel 3 | 47 | Speed Input 1 |
| 20 | Analog Input Channel 4 | 48 | Speed Input 2 |
| 21 | CAN 1 High | 49 | Speed Input 3 |
| 22 | CAN 1 Low | 50 | Speed Input 4 |
| 23 | CAN 2 High | 51 | Video Input 4 |
| 24 | CAN 2 Low | 52 | Video 0V Reference |
| 25 | Analog Input 0V Reference | 53 | LIN Bus |
| 26 | Analog Input 0V Reference | 54 | Speed 0V Reference |
| 27 | Headphone 0V Reference | 55 | ED10M Recovery |
| 28 | CAN 3 High |
| Pin | Channel Name |
|---|---|
| 1 | 14V Supply + |
| 2 | Ground - |
| 5 | 14V Backup Supply + |
| Pin | Channel Name |
|---|---|
| 10 | Sensor Supply: 5.0V |
| 11 | Sensor Supply: 5.0V |
| 12 | Sensor Supply: 5.0V |
| 4 | 12V Regulated Output |
| Emtron Pin | RJ45 Pin T-568A | Description | Cat5e Wire Colour |
|---|---|---|---|
| 3 | Ethernet Shield | ||
| 6 | 1 | Ethernet Tx/Rx + Pair 1 | Green/White |
| 7 | 2 | Ethernet Tx/Rx - Pair 1 | Green |
| 13 | 3 | Ethernet Tx/Rx + Pair 2 | Orange/White |
| 14 | 6 | Ethernet Tx/Rx - Pair 2 | Orange |
| 8 | 4 | Ethernet Tx/Rx + Pair 3 | Blue |
| 9 | 5 | Ethernet Tx/Rx - Pair 3 | Blue/White |
| 15 | 7 | Ethernet Tx/Rx + Pair 4 | Brown/White |
| 16 | 8 | Ethernet Tx/Rx - Pair 4 | Brown |
NOTE: The Orange/White and Brown/White can often look very similar in colour so make sure the correct wire is used.
| Pin | Channel Name |
|---|---|
| 21 | CAN 1 High |
| 22 | CAN 1 Low |
| 23 | CAN 2 High |
| 24 | CAN 2 Low |
| 28 | CAN 3 High |
| 29 | CAN 3 Low |
| 30 | CAN 4 High |
| 31 | CAN 4 Low |
| Pin | Channel Name |
|---|---|
| 40 | RS232 Transmit Output |
| 41 | RS232 Receive Input |
| 42 | RS232 0V Reference |
| 53 | LIN Bus |
| Pin | Channel Name |
|---|---|
| 17 | Analog Input Channel 1 |
| 18 | Analog Input Channel 2 |
| 19 | Analog Input Channel 3 |
| 20 | Analog Input Channel 4 |
| 32 | Analog Input Channel 5 |
| 33 | Analog Input Channel 6 |
| 34 | Analog Input Channel 7 |
| 35 | Analog Input Channel 8 |
| 25 | Analog Input 0V Reference |
| 26 | Analog Input 0V Reference |
| Pin | Channel Name |
|---|---|
| 47 | Speed Input 1 |
| 48 | Speed Input 2 |
| 49 | Speed Input 3 |
| 50 | Speed Input 4 |
| 54 | Speed 0V Reference |
| Pin | Channel Name |
|---|---|
| 43 | Video Input 1 |
| 44 | Video Input 2 |
| 45 | Video Input 3 |
| 51 | Video Input 4 |
| 52 | Video 0V Reference |
| Pin | Channel Name |
|---|---|
| 36 | Headphone Output LH |
| 37 | Headphone Output RH |
| 27 | Headphone 0V Reference |
| 38 | Mic Input LH |
| 39 | Mic Input RH |
| 46 | Mic 0V Reference |
This is a switched 14V supply. Constant power should not be supplied on this pin.
A Constant 14V supply should be wired to this pin. When the power is removed from pin “14V Switched Supply” the ED10M automatically switches to the " 14V Backup Supply” to keep itself powered. This will allow the ED10M to complete critical tasks before shutting itself down (for example data logging storage).
NOTE: When the “14V Backup Supply” is wired to the ED10M, no additional current is drawn when the device is OFF.
As the name indicates these should be connected directly to the 0V (Ground) pin on any low current analog sensor, for example Pressure or Temperature.
This is a dedicated 0V reference for the microphone.
WarningDo not share this pinVideo inputs are multiplexed, only one input can be captured at a time.
Pin 40 is the ED10M RS232 Transmit Output. As the name suggests this is an Output and should be connected to the Receive Input of the wired external device.
Pin 41 is the ED10M RS232 Receive Input. As the name suggests this is an Input and should be connected to the Transmit Output of the wired external device.
This is the wiring standard when working with RS232 communications.
In the unlikely event the SOM becomes bricked after a software update, grounding this pin at power-on allows the device to be recovered by loading software through the USB Port. (Normally this would be done over Ethernet using the Display Editor software )
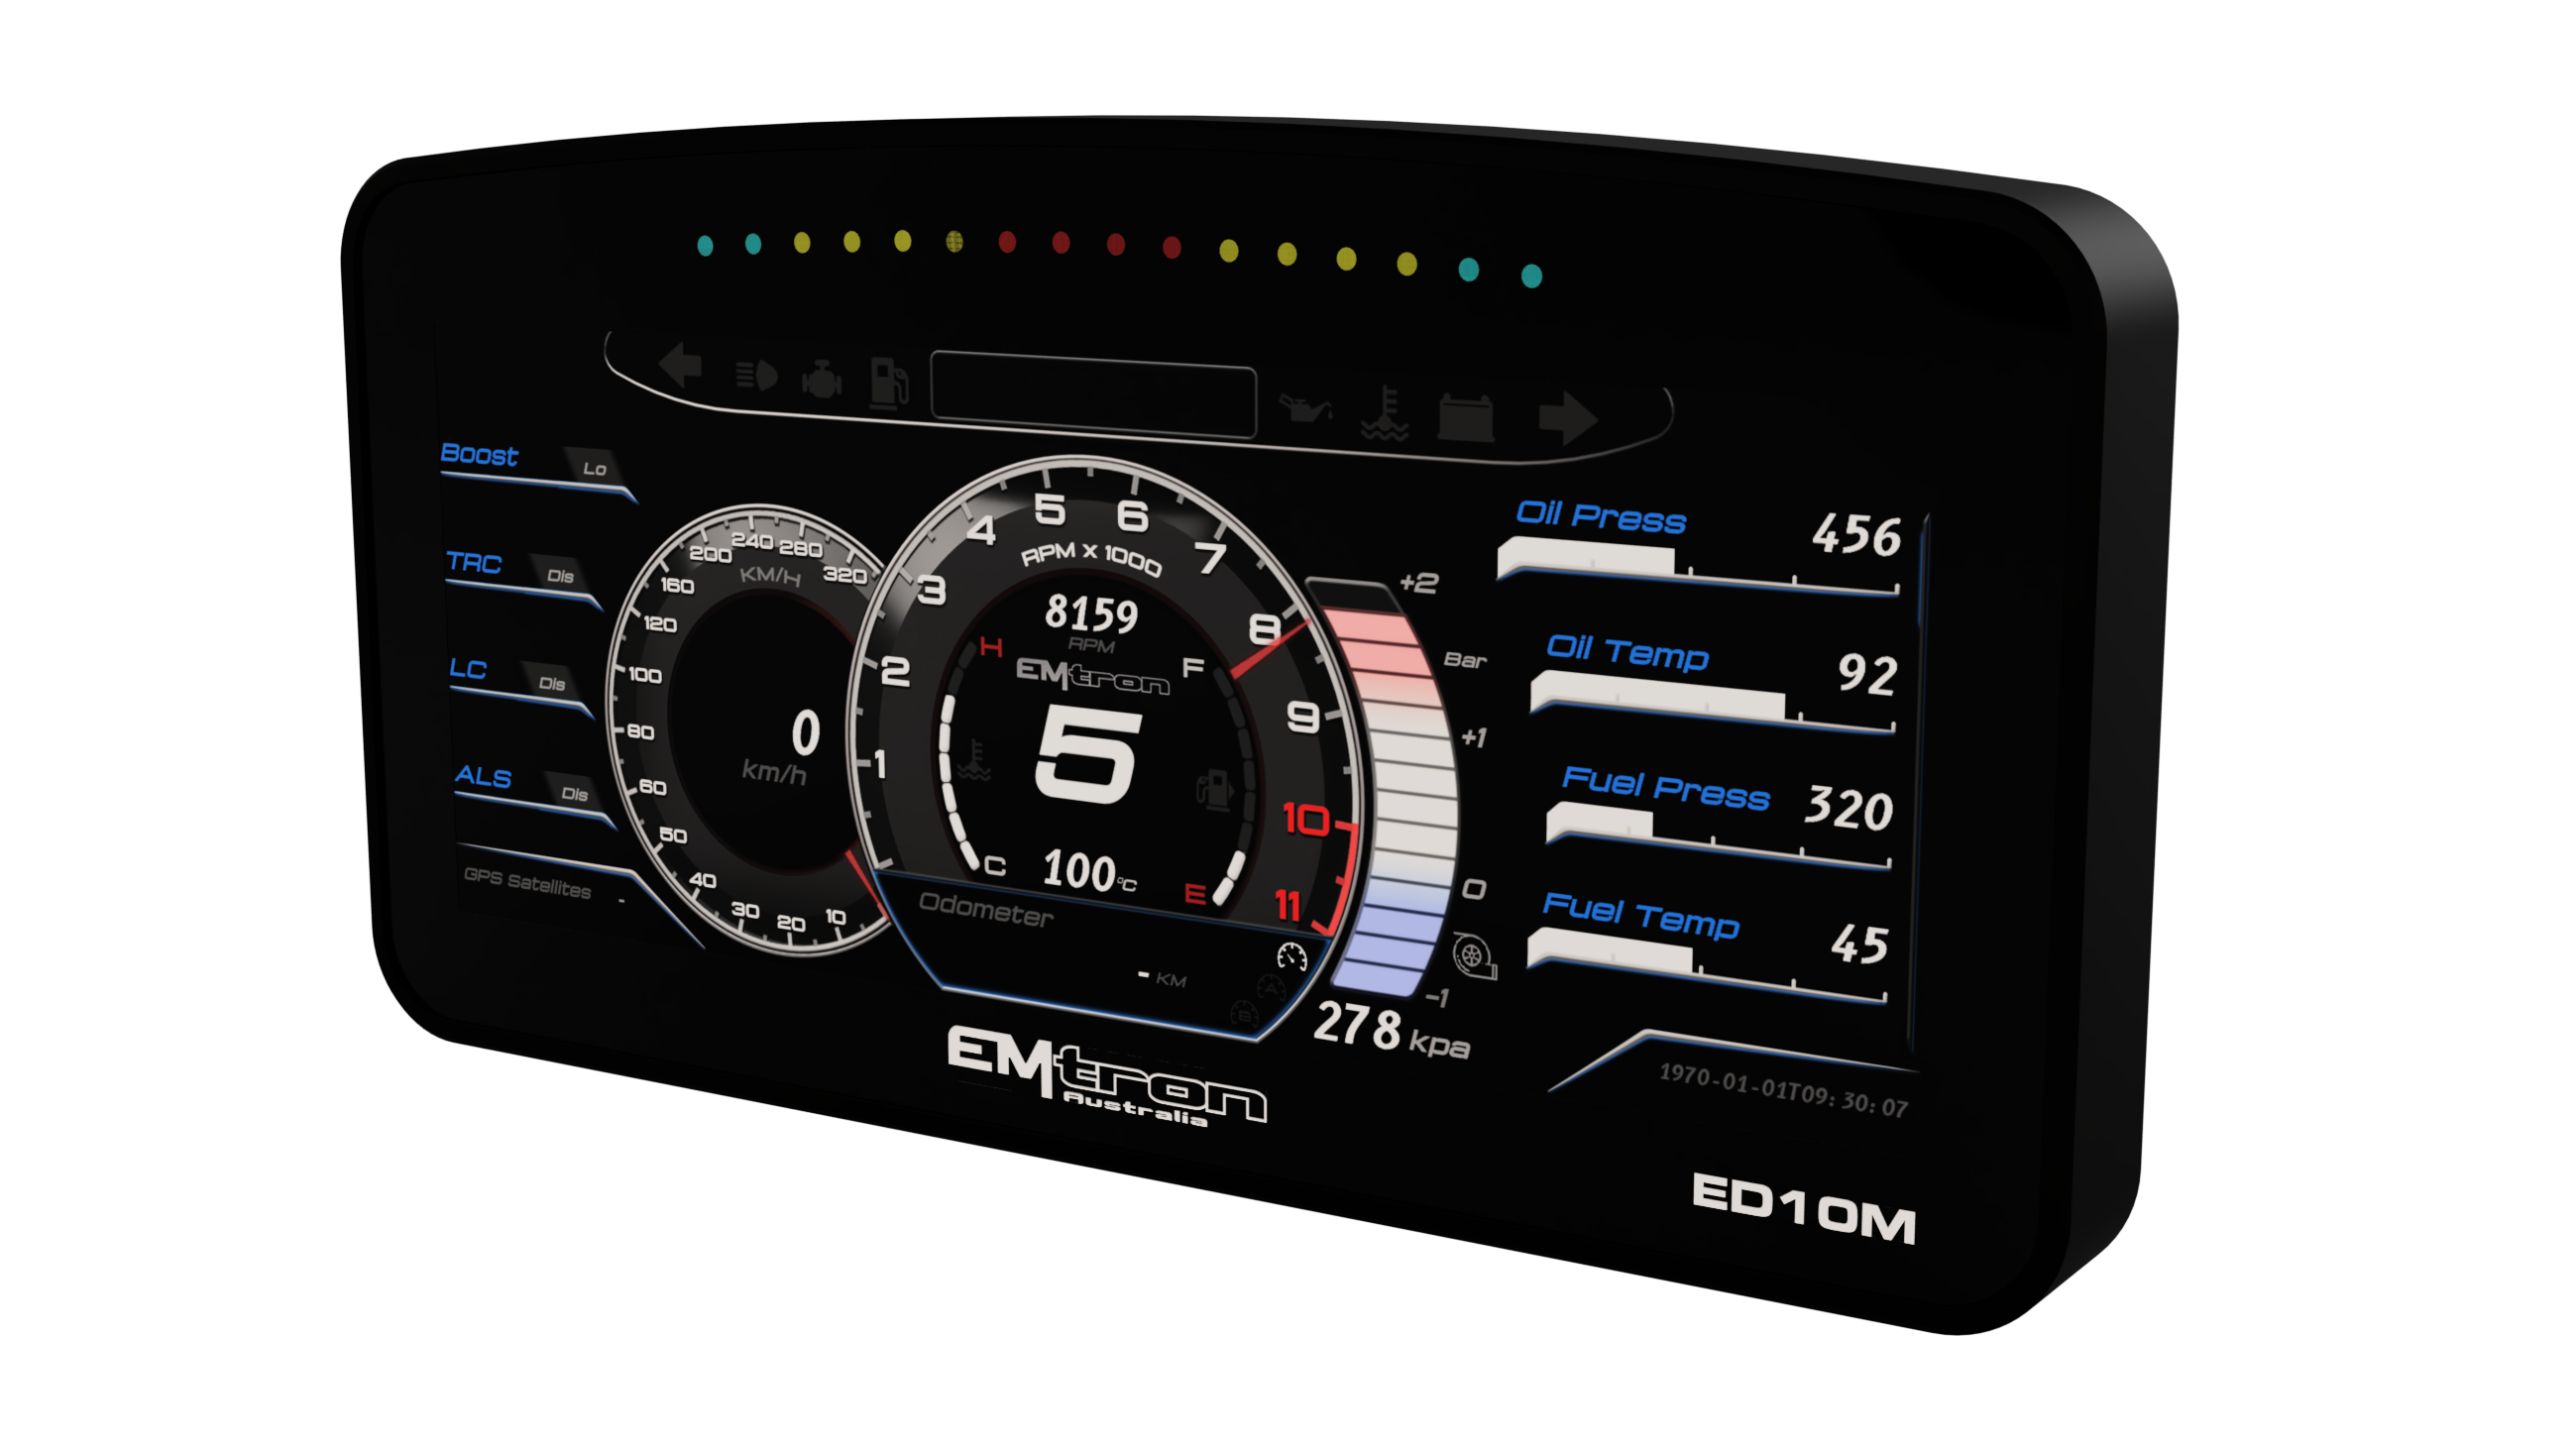
8x Analog Voltage
4x Frequency Inputs
Full In-field firmware updatable over Ethernet using the Emtron Display Setup Tool
Connector 8D0C17Z35PN: (5.0A continuous current. Shell size 17, 55 Pin. 22 AWG)
Looking into Connector
Mating Connector 8DA5-17Z35SN
| Pin | Channel Name | Pin | Channel Name |
|---|---|---|---|
| 1 | 14V Switched Supply | 29 | CAN 3 Low |
| 2 | Ground | 30 | CAN 4 High |
| 3 | Gigabit Ethernet Shield | 31 | CAN 4 Low |
| 4 | 12V Regulated Output | 32 | Analog Input Channel 5 |
| 5 | 14V Backup Supply | 33 | Analog Input Channel 6 |
| 6 | Gigabit Ethernet +Tx/Rx Pair 1 | 34 | Analog Input Channel 7 |
| 7 | Gigabit Ethernet -Tx/Rx Pair 1 | 35 | Analog Input Channel 8 |
| 8 | Gigabit Ethernet +Tx/Rx Pair 3 | 36 | Headphone LH |
| 9 | Gigabit Ethernet -Tx/Rx Pair 3 | 37 | Headphone RH |
| 10 | Sensor Supply: 5.0V | 38 | Mic Input LH |
| 11 | Sensor Supply: 5.0V | 39 | Mic Input RH |
| 12 | Sensor Supply: 5.0V | 40 | RS232 Transmit Output |
| 13 | Gigabit Ethernet +Tx/Rx Pair 2 | 41 | RS232 Receive Input |
| 14 | Gigabit Ethernet -Tx/Rx Pair 2 | 42 | RS232 0V Reference |
| 15 | Gigabit Ethernet +Tx/Rx Pair 4 | 43 | Video Input 1 |
| 16 | Gigabit Ethernet -Tx/Rx Pair 4 | 44 | Video Input 2 |
| 17 | Analog Input Channel 1 | 45 | Video Input 3 |
| 18 | Analog Input Channel 2 | 46 | Mic 0V Reference |
| 19 | Analog Input Channel 3 | 47 | Speed Input 1 |
| 20 | Analog Input Channel 4 | 48 | Speed Input 2 |
| 21 | CAN 1 High | 49 | Speed Input 3 |
| 22 | CAN 1 Low | 50 | Speed Input 4 |
| 23 | CAN 2 High | 51 | Video Input 4 |
| 24 | CAN 2 Low | 52 | Video 0V Reference |
| 25 | Analog Input 0V Reference | 53 | LIN Bus |
| 26 | Analog Input 0V Reference | 54 | Speed 0V Reference |
| 27 | Headphone 0V Reference | 55 | ED10M Recovery |
| 28 | CAN 3 High |
| Pin | Channel Name |
|---|---|
| 1 | 14V Supply + |
| 2 | Ground - |
| 5 | 14V Backup Supply + |
| Pin | Channel Name |
|---|---|
| 10 | Sensor Supply: 5.0V |
| 11 | Sensor Supply: 5.0V |
| 12 | Sensor Supply: 5.0V |
| 4 | 12V Regulated Output |
| Emtron Pin | RJ45 Pin T-568A | Description | Cat5e Wire Colour |
|---|---|---|---|
| 3 | Ethernet Shield | ||
| 6 | 1 | Ethernet Tx/Rx + Pair 1 | Green/White |
| 7 | 2 | Ethernet Tx/Rx - Pair 1 | Green |
| 13 | 3 | Ethernet Tx/Rx + Pair 2 | Orange/White |
| 14 | 6 | Ethernet Tx/Rx - Pair 2 | Orange |
| 8 | 4 | Ethernet Tx/Rx + Pair 3 | Blue |
| 9 | 5 | Ethernet Tx/Rx - Pair 3 | Blue/White |
| 15 | 7 | Ethernet Tx/Rx + Pair 4 | Brown/White |
| 16 | 8 | Ethernet Tx/Rx - Pair 4 | Brown |
NOTE: The Orange/White and Brown/White can often look very similar in colour so make sure the correct wire is used.
| Pin | Channel Name |
|---|---|
| 21 | CAN 1 High |
| 22 | CAN 1 Low |
| 23 | CAN 2 High |
| 24 | CAN 2 Low |
| 28 | CAN 3 High |
| 29 | CAN 3 Low |
| 30 | CAN 4 High |
| 31 | CAN 4 Low |
| Pin | Channel Name |
|---|---|
| 40 | RS232 Transmit Output |
| 41 | RS232 Receive Input |
| 42 | RS232 0V Reference |
| 53 | LIN Bus |
| Pin | Channel Name |
|---|---|
| 17 | Analog Input Channel 1 |
| 18 | Analog Input Channel 2 |
| 19 | Analog Input Channel 3 |
| 20 | Analog Input Channel 4 |
| 32 | Analog Input Channel 5 |
| 33 | Analog Input Channel 6 |
| 34 | Analog Input Channel 7 |
| 35 | Analog Input Channel 8 |
| 25 | Analog Input 0V Reference |
| 26 | Analog Input 0V Reference |
| Pin | Channel Name |
|---|---|
| 47 | Speed Input 1 |
| 48 | Speed Input 2 |
| 49 | Speed Input 3 |
| 50 | Speed Input 4 |
| 54 | Speed 0V Reference |
| Pin | Channel Name |
|---|---|
| 43 | Video Input 1 |
| 44 | Video Input 2 |
| 45 | Video Input 3 |
| 51 | Video Input 4 |
| 52 | Video 0V Reference |
| Pin | Channel Name |
|---|---|
| 36 | Headphone Output LH |
| 37 | Headphone Output RH |
| 27 | Headphone 0V Reference |
| 38 | Mic Input LH |
| 39 | Mic Input RH |
| 46 | Mic 0V Reference |
This is a switched 14V supply. Constant power should not be supplied on this pin.
A Constant 14V supply should be wired to this pin. When the power is removed from pin “14V Switched Supply” the ED10M automatically switches to the " 14V Backup Supply” to keep itself powered. This will allow the ED10M to complete critical tasks before shutting itself down (for example data logging storage).
NOTE: When the “14V Backup Supply” is wired to the ED10M, no additional current is drawn when the device is OFF.
As the name indicates these should be connected directly to the 0V (Ground) pin on any low current analog sensor, for example Pressure or Temperature.
This is a dedicated 0V reference for the microphone.
WarningDo not share this pinVideo inputs are multiplexed, only one input can be captured at a time.
Pin 40 is the ED10M RS232 Transmit Output. As the name suggests this is an Output and should be connected to the Receive Input of the wired external device.
Pin 41 is the ED10M RS232 Receive Input. As the name suggests this is an Input and should be connected to the Transmit Output of the wired external device.
This is the wiring standard when working with RS232 communications.
In the unlikely event the SOM becomes bricked after a software update, grounding this pin at power-on allows the device to be recovered by loading software through the USB Port. (Normally this would be done over Ethernet using the Display Editor software )
The Diagnostics menu provides tools for verifying a connected display, inspecting live data, and replaying logs. These pages act on the live device or on log files — they are not part of the saved configuration.
Trigger camera and installation test actions on a connected display.
Real-time channel plotting while connected to a display.
Enable or disable display backend modules at runtime.
Upload, select, and replay log files through Display Studio.
Diagnostics → Test Functions
Test Functions send one-shot commands to a connected display so you can verify installation without building a temporary screen layout.
| Action | What it does |
|---|---|
| Show Camera Full Screen | Shows the camera overlay full screen on the display |
| Hide Full Screen Camera | Hides the full-screen camera overlay |
| Select Camera Input 1–4 | Switches the active camera input |
Use these after wiring cameras to confirm the correct input and that full-screen preview works on the device.
Audio test actions appear in the list for future installation checks. Some may be disabled until the audio feature is available on your firmware.
Diagnostics → Live Plots
Live Plots shows real-time traces of selected channels while the display is connected. Use it to verify sensors, maths outputs, and timing channels without leaving Studio.
For longer capture and offline review, configure Logging and download logs from Home, or use Log Replay for files already on the PC or device.
Diagnostics → Module Control
Module Control lists backend modules running on the connected display. You can enable or disable non-critical modules at runtime to isolate problems or free resources while testing.
Some modules are marked Always on. They cannot be disabled at runtime because the display needs them for basic operation.
Diagnostics → Log Replay
Log Replay plays back recorded channel data so you can review a run without the vehicle running. Use it with logs downloaded from the display or files you upload from the PC.
| Action | Description |
|---|---|
| Refresh | Reload the list of available logs |
| Upload… | Add a log file from the PC (e.g. .elo / product log types supported by the dialog) |
| Delete | Remove an Uploaded log from the local list (device logs are not deleted from the display here) |
Select a log in the list to load it for replay.
After a log is selected, pick which channels to include in the replay stream. Use the search field to find channels by name.
Use the replay controls (play / pause / seek as provided on the page) to move through the recording. Live data and gauges that listen to the same channel stream will follow the replayed values while playback is active.
Steps to resolve connection issues between your PC and Emtron displays.
If you are unable to connect to an Emtron display from your PC, the most common cause is security software blocking the connection. Work through the steps below in order.
Some antivirus programs actively block network connections to unknown devices, even on a local network. Temporarily disabling your antivirus is the quickest way to determine whether it is the cause.
Note: The exact steps vary by antivirus product. Refer to your software’s documentation if you cannot find the disable option.
Windows Firewall may block incoming or outgoing traffic to the display. Adding an exception allows the connection while keeping the firewall active.
If the display is connected over Wi-Fi or a dedicated Ethernet adapter, ensure the adapter is set to a Private network profile. Windows restricts some traffic on Public networks.
If none of the above steps resolve the connection problem, please contact Emtron support.
Kit Contents — When purchasing an ED5 the following items are included:
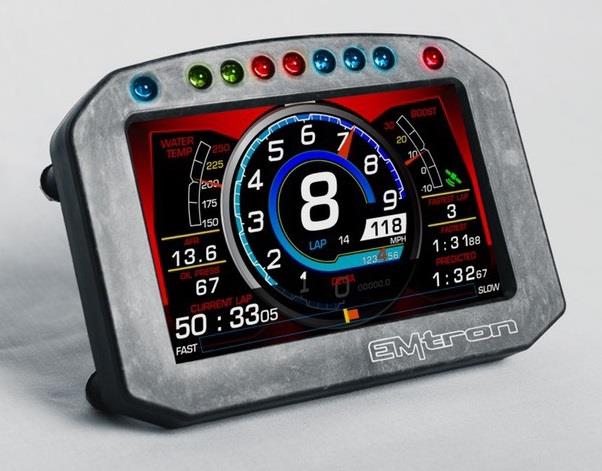
The Emtron ED5 5" digital dash display.
The ED5 features a full-colour, daylight readable screen surrounded by a tough, lightweight flow-moulded carbon fibre composite housing. Seven ultra-bright LEDs span the top of the display housing for RPM and shift light indication. Users can program them to ascend in specific increments based on RPM range and flash when it is time to shift. Brightness is user programmable on the fixed colour LEDs. Button functions are included in the supplied rear connector, allowing the user to mount remote buttons. Two additional programmable LEDs are located on the top of the housing on either side of the integrated LED shift lights.
Inputs
Communications
Operating Temperature
Physical
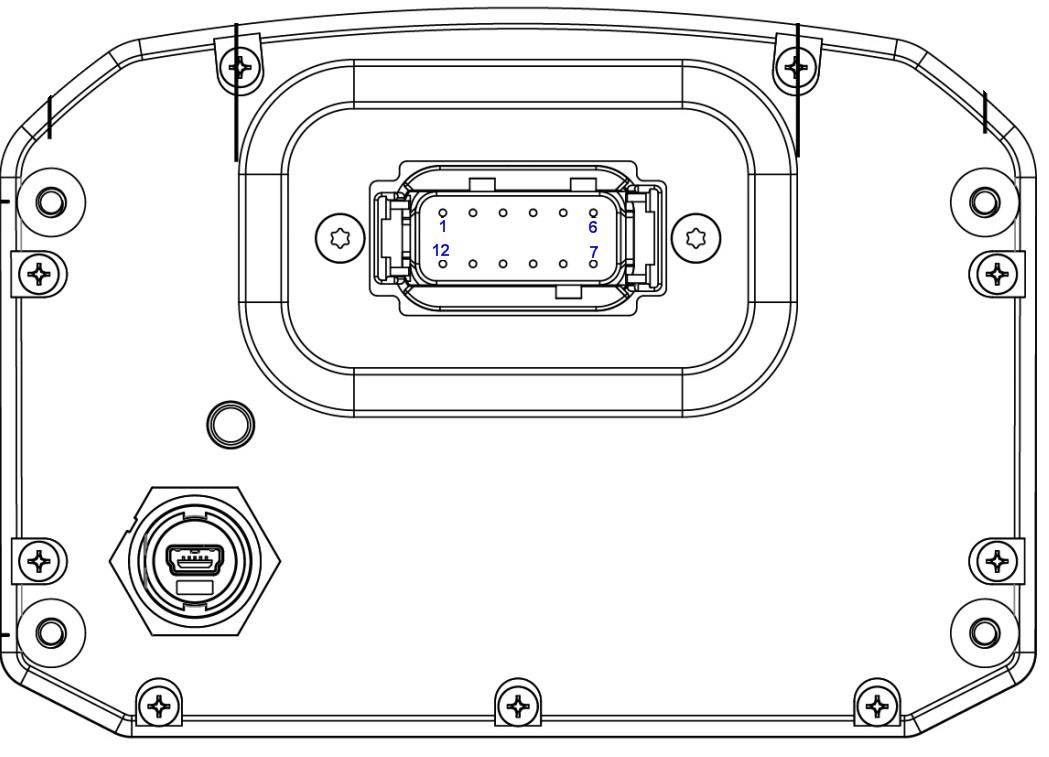
ED5 12-way DTM connector.
Table 3.1 — ED5 Pinout
| Pin | Function |
|---|---|
| 1 | 14 V Supply |
| 2 | Ground |
| 3 | CAN 1 Hi |
| 4 | CAN 1 Lo |
| 5 | CAN 2 Hi |
| 6 | CAN 2 Lo |
| 7 | Page Up |
| 8 | Reset/Ack |
| 9 | Night Mode |
| 10 | Beacon |
| 11 | User 1 Input (spare1) |
| 12 | User 2 Input (spare2) |
The ED5 includes an on-board CAN termination resistor. It is switchable in the Emtron Display Editor software to allow the device to be wired at any position on the Bus, provided the termination resistor is turned off. If the ED5 is the only device connected to the ECU on the CAN bus, it is advised to switch the termination resistor on to provide termination at the display end of the CAN bus. CAN Bus termination must be done correctly by using a 120 ohm 0.25W resistor at each end of the bus system.
CAN bus wiring precautions
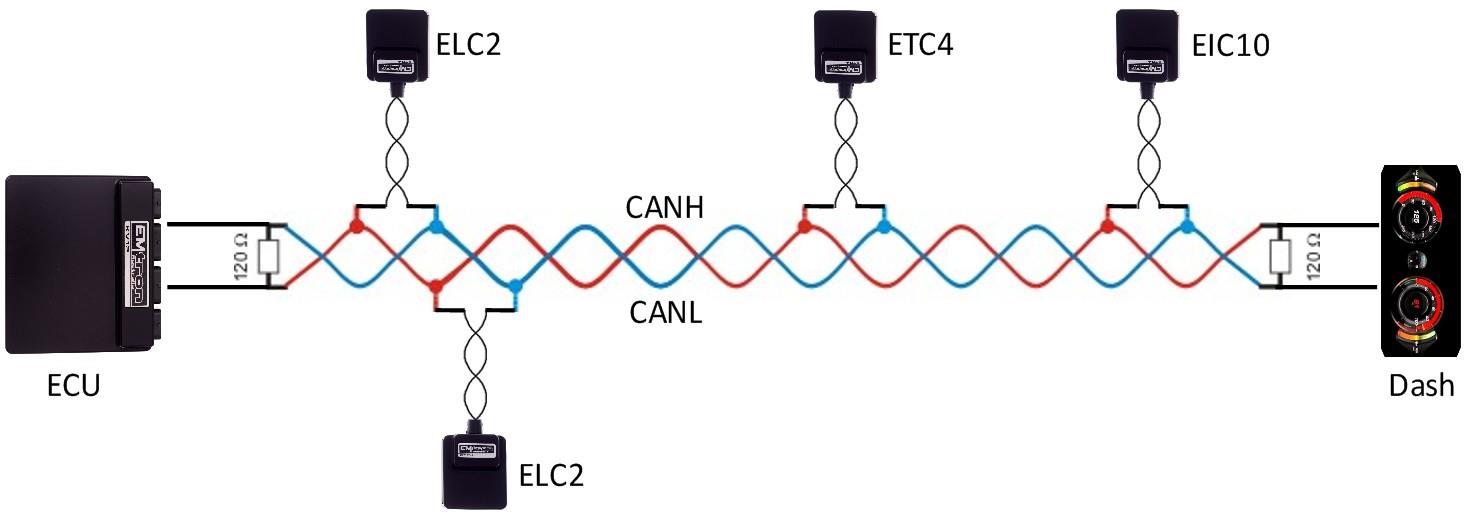
Figure 3.1 — CAN Bus wiring example: ECU and Dash at each end with 120 Ohm termination.
Download the latest version of Emtron Display Editor from https://emtron.world/downloads/. Install by opening the downloaded installer and following the instructions provided. Once the install is complete there will be a shortcut icon on the desktop.
USB drivers will be installed automatically.
Once the ED5 and ECU are powered and connected to the CAN bus, the ECU must be configured to send CAN packets. The ED5 is shipped pre-configured with a sample configuration file that will allow communications, provided the ECU is set up to send the correct CAN IDs.
NoteNOTE The ED5 will not switch into run mode with the USB cable connected to the PC. Make sure this is unplugged for normal operation.
Ensure the ECU firmware Version is 2.17.0. If using earlier firmware versions, the display may still be operational; however, some functionality and channels will not be available.
Make sure the ECU is powered up and Online in Emtune. Go to Config View → Communications → CAN Bus 1 → CAN Bus 1 Setup → CAN 1 Baud Rate and set to 1Mbps.
Open the first available Channel. If there is nothing else already configured on the CAN bus, then CAN 1 Channel 1 would be the first available channel. If this channel is already used, simply select a channel that is free — the CAN 1 channel number selection has no effect on the operation. Set CAN 1 – Channel 1 and CAN 1 – Channel 2 as per the setup figures.
Store setting changes permanently in the ECU by pressing F4. Switch power OFF and ON to the ECU to ensure the updated CAN bus settings have been initialised. The ED5 should now be receiving and displaying live runtimes included in the Emtron Display Tx Set 1 and Emtron Display Tx Set 2.
| Product | Part Number |
|---|---|
| Emtron ED5 | 54-052F |
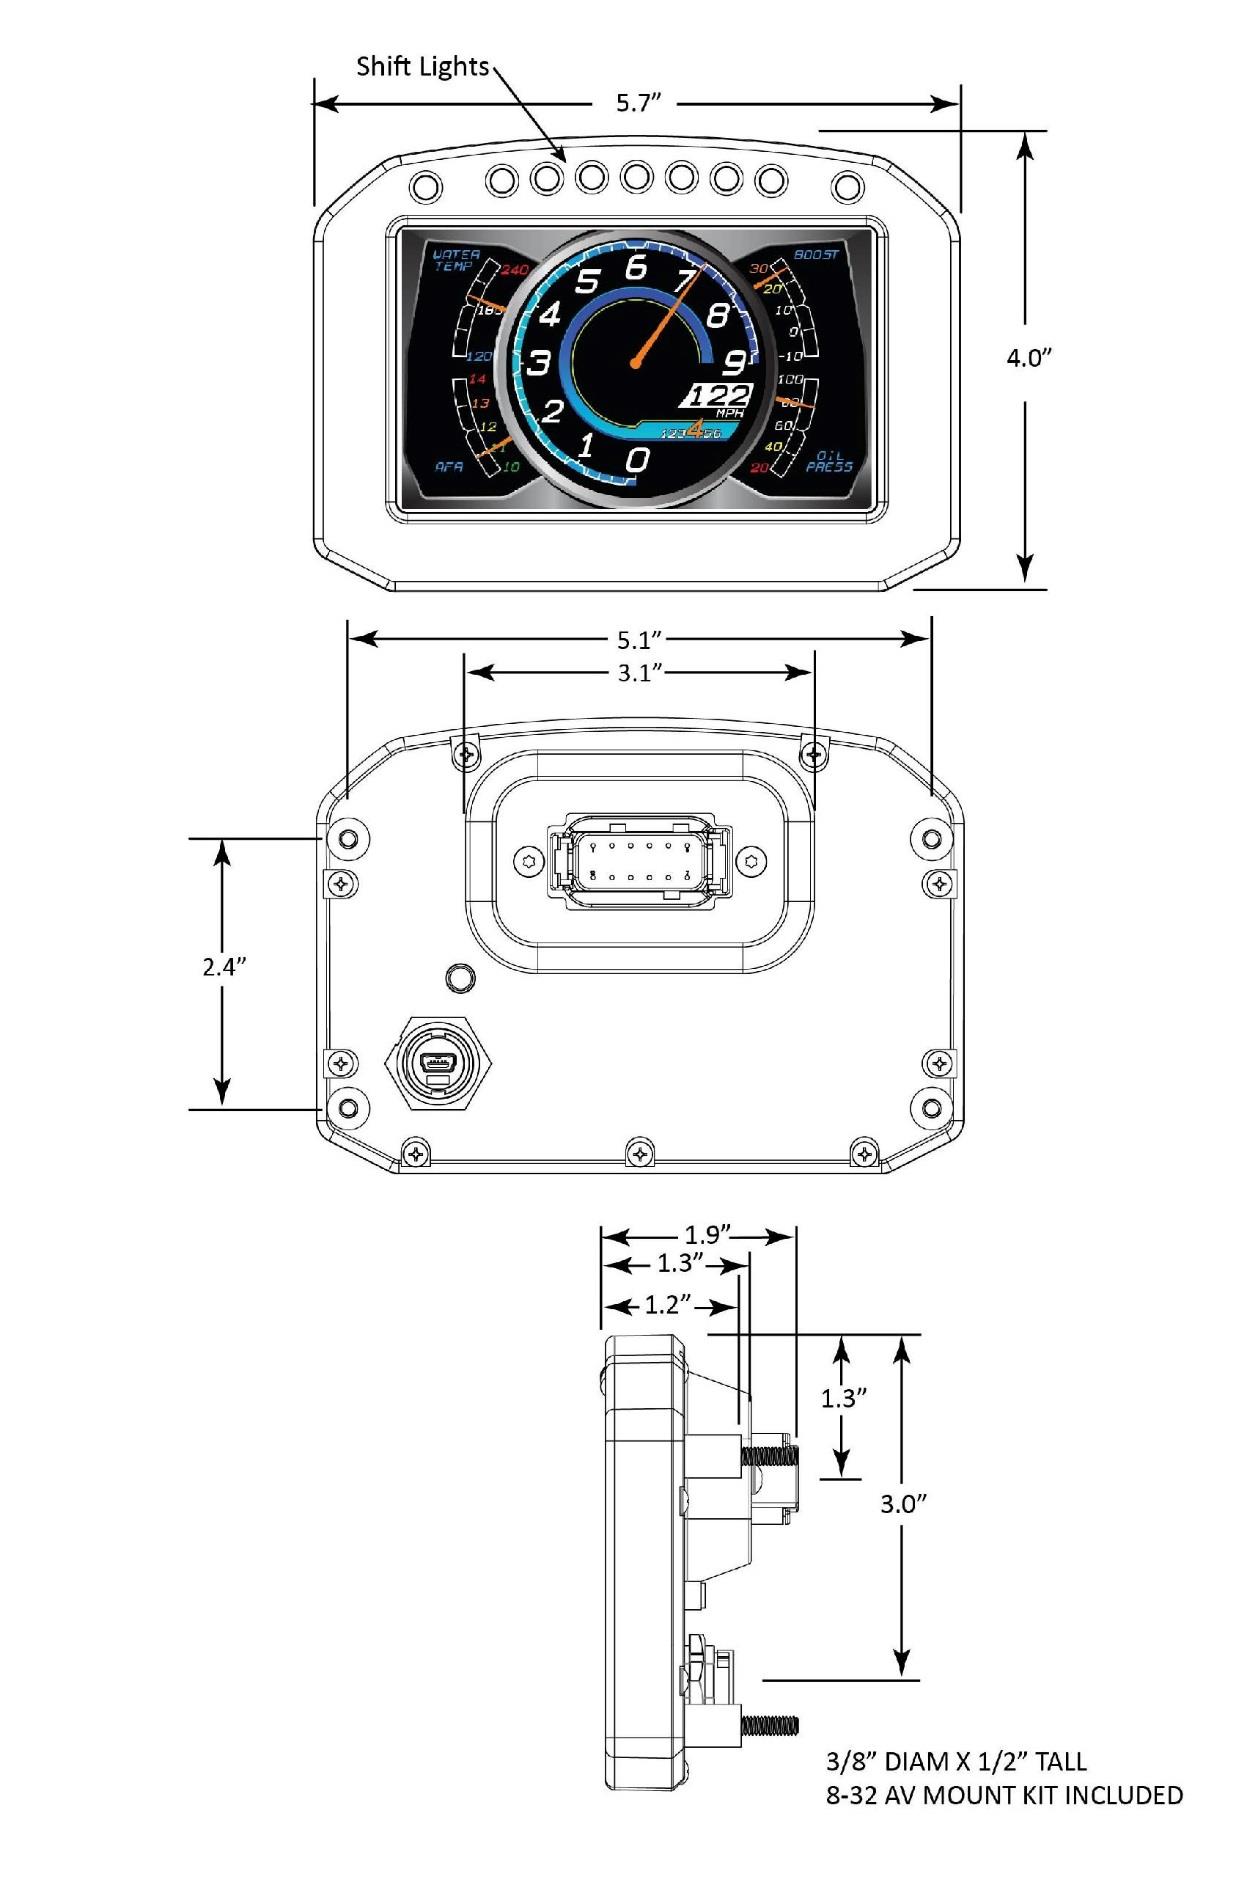
ED5 mechanical drawing.