Subsections of Diagnostics
Cylinder Inhibit Functions
Cylinder Inhibit Function


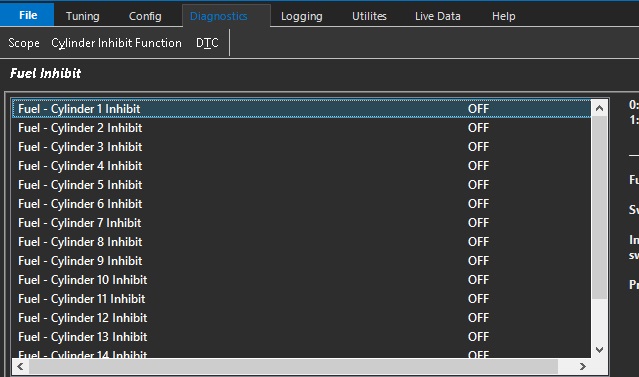

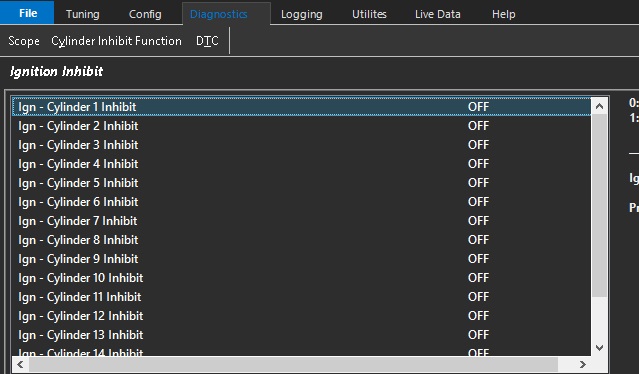
DTC's
System errors within the ECU show up as DTC Errors illuminated in red in the Emtune software.
They are also associated with the engine check light, should one be configured.
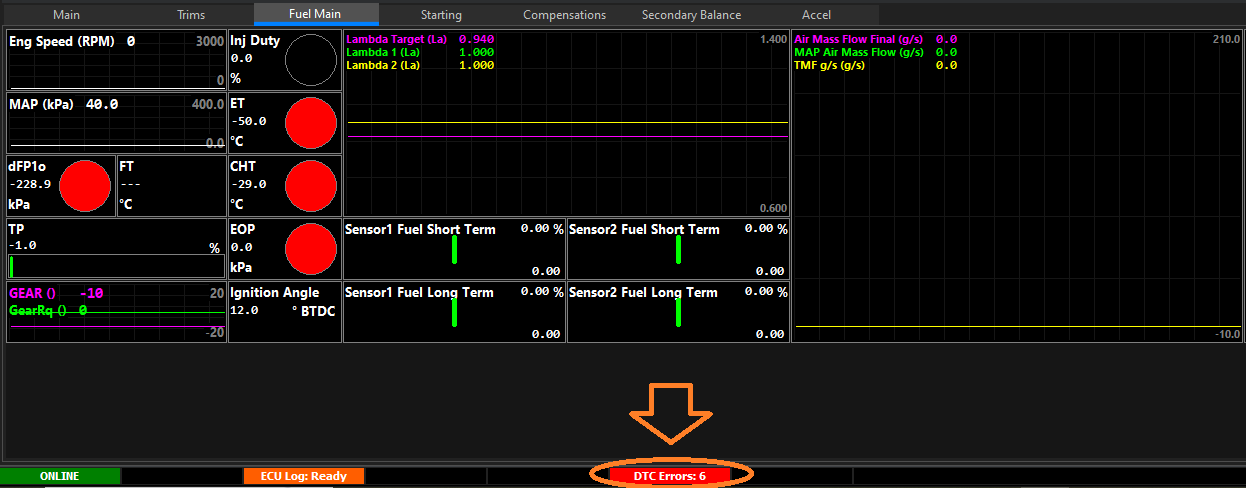
The source of the error is straight forward to determine.
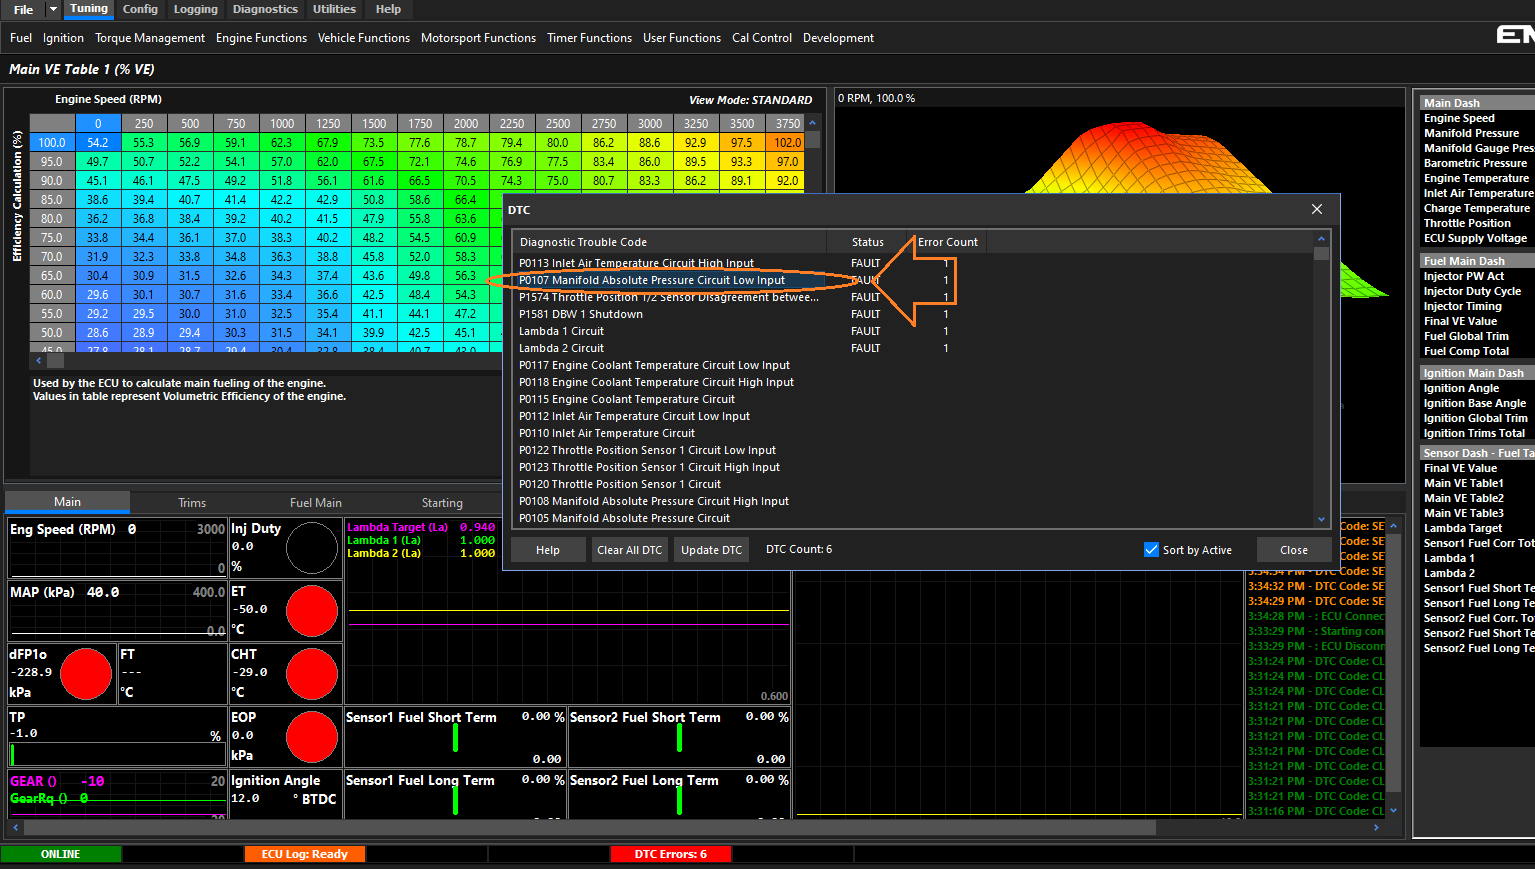
Click on the red DTC tab & a breakout DTC list will appear.
This list will contain all of the current errors.
For this example, we will look at P0107 - Manifold Absolute Pressure Circuit Low Input.
Press F3 to open the ECU Runtime Values Tab
Using the Raw inputs tab, determine if the voltage observed at the input is within the defined range of operation
Ensure the input calibration error threshold is set outside the normal operating range of the sensor.
If the calibration data is correct together with correctly set error thresholds.
The error can be considered valid and should be investigated.
A valid version of the example error (P0107) may indicate a dead short or simply the sensor is unplugged
What is a Diagnostic Trouble Code (DTC)?
Diagnostic trouble codes (or fault codes) are codes that are stored by the ECU. These are stored in response to a problem when a sensor in the car reports a reading that is outside the normal/accepted range
These DTC’s identify a particular problem area and are intended to provide the user with a guide as to where a fault might be occurring within the vehicle. The ECU will always reply with a ‘P’ code or Powertrain code
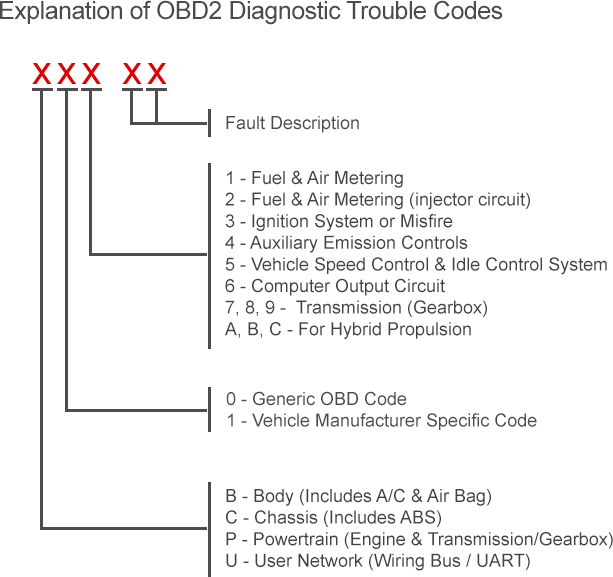
Difference Between Generic & Manufacturer Specific…
| Code type | Explanation |
|---|---|
| Generic (normally P0xxx) | The definition for the code is defined in the EOBD / OBD-II standard and will be the same for all manufacturers. |
| Manufacturer-specific (normally P1xxx) | Where manufacturers feel that a code is not available within the generic list, they can add their own codes. The definitions for these are set by the manufacturer. |
In general, codes that begin with P0 are Generic codes, whereas codes that begin with P1 are manufacturer-specific in this case codes generated by Emtron.
Injector Test
Injector Test
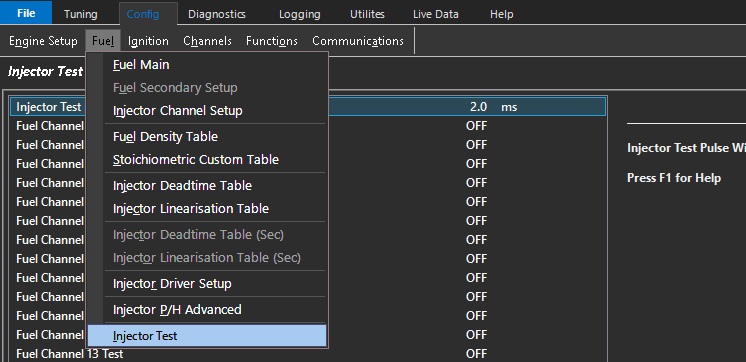
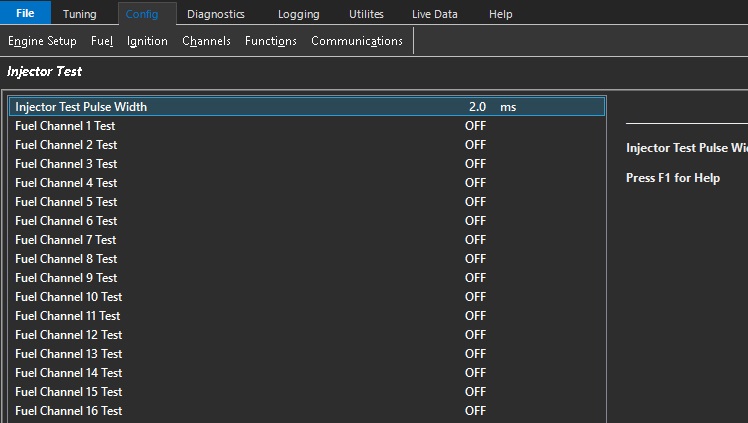
Injector test permits individual testing of each injector - Systems check / Diagnostic Tool
Scope Utility
Emtron features a built in Scope for all ECU types except the Shadow 8. Depending on the ECU (or if a plug in model – the type it is based off of), the number of channels that can be scoped is variable:
| ECU | Channels |
|---|---|
| Shadow 8 | NA |
| SL4 | Crank, Sync |
| SL6 | Crank, Sync |
| SL8 | Crank, Sync |
| KV8 | Crank, Sync, DI 1-4 |
| KV12 | Crank, Sync, DI 1-8 |
| KV16 | Crank, Sync, DI 1-8 |
| KV16M | Crank, Sync, DI 1-8 |
The scope function records the channels assigned to internal memory when started/stopped.
The memory can be subsequently downloaded, erased, saved, and loaded by the other buttons in the scope tools.
Utilities > Scope

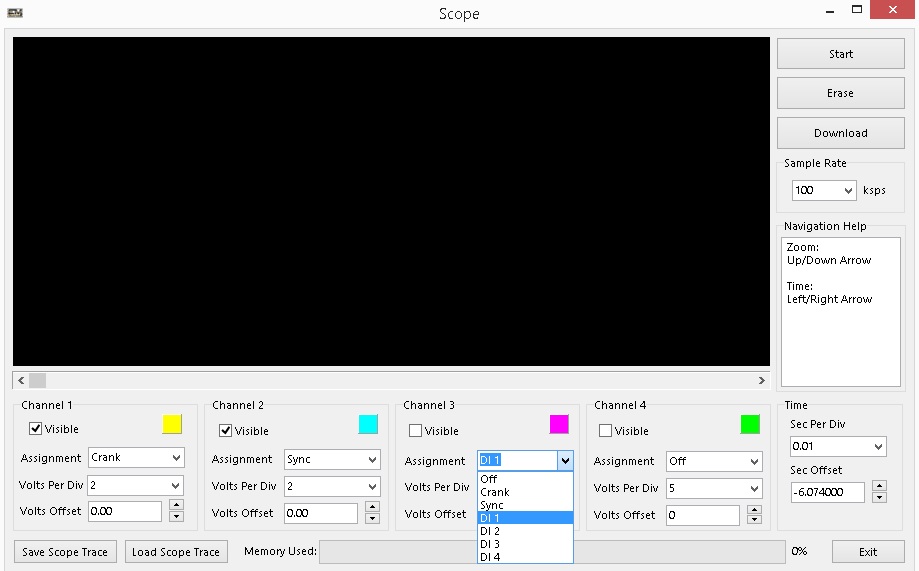
When you select Scope, it opens a new window with the Scope.
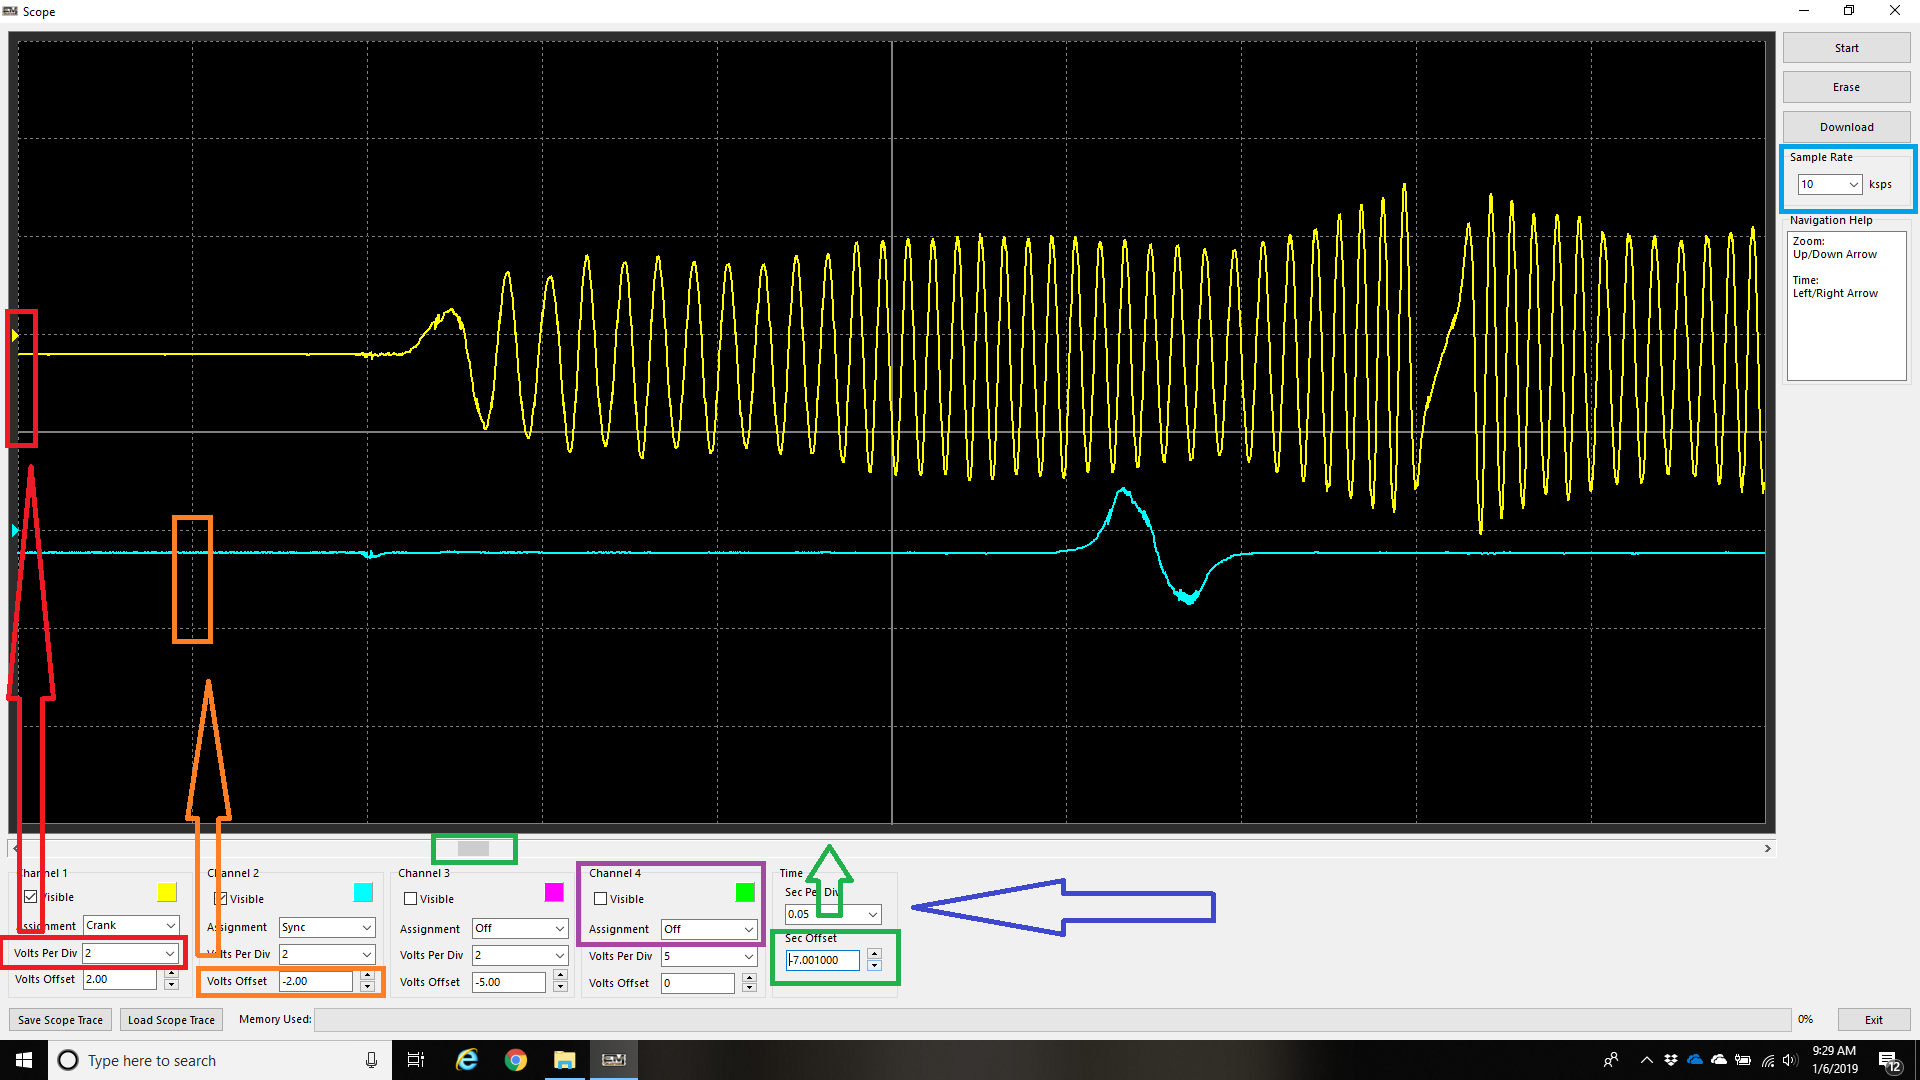
Configuration details are as follows:
Purple:
Select what channel to display, and whether you want the trace to be visible or not
Red:
Change the volts per division for each channel
The chart is divided in blocks up and down. Each block equals 2 volts in the above example.
Orange:
The traces can be offset so they do not overlay on top of each other. The default value is 0.00V, meaning the voltage will trace from the centre (so it will read +/- 0V). It is useful to offset the traces, so they can be all visible at the same time on the chart as in the above example.
Green:
Sec Offset moves the trace to a specific position
Blue:
Time Sec Per Div changes the zoom level of the scope by adjusting the time per division horizontally. Like voltage per division vertically. After starting and stopping the scope, this will need to be adjusted until a trace draws an appropriate picture as in the example above.
Light Blue:
Sample Rate should be adjusted to set the scope recording rate. In most cases the default value of 10ksps should be enough, but if scope traces are requested for troubleshooting purposes (on running engines for example – not just for trigger decoding requests), then a higher speed may be requested.
** Note a higher sampling rate will use up the Emtron internal memory much faster. A shorter period of recording should be anticipated (a few seconds generally).
Scope Voltage Clipping
The scope can only read +/- 25v. Anything over 25v (regardless of input specifications) will display signals that can be misconstrued as error.
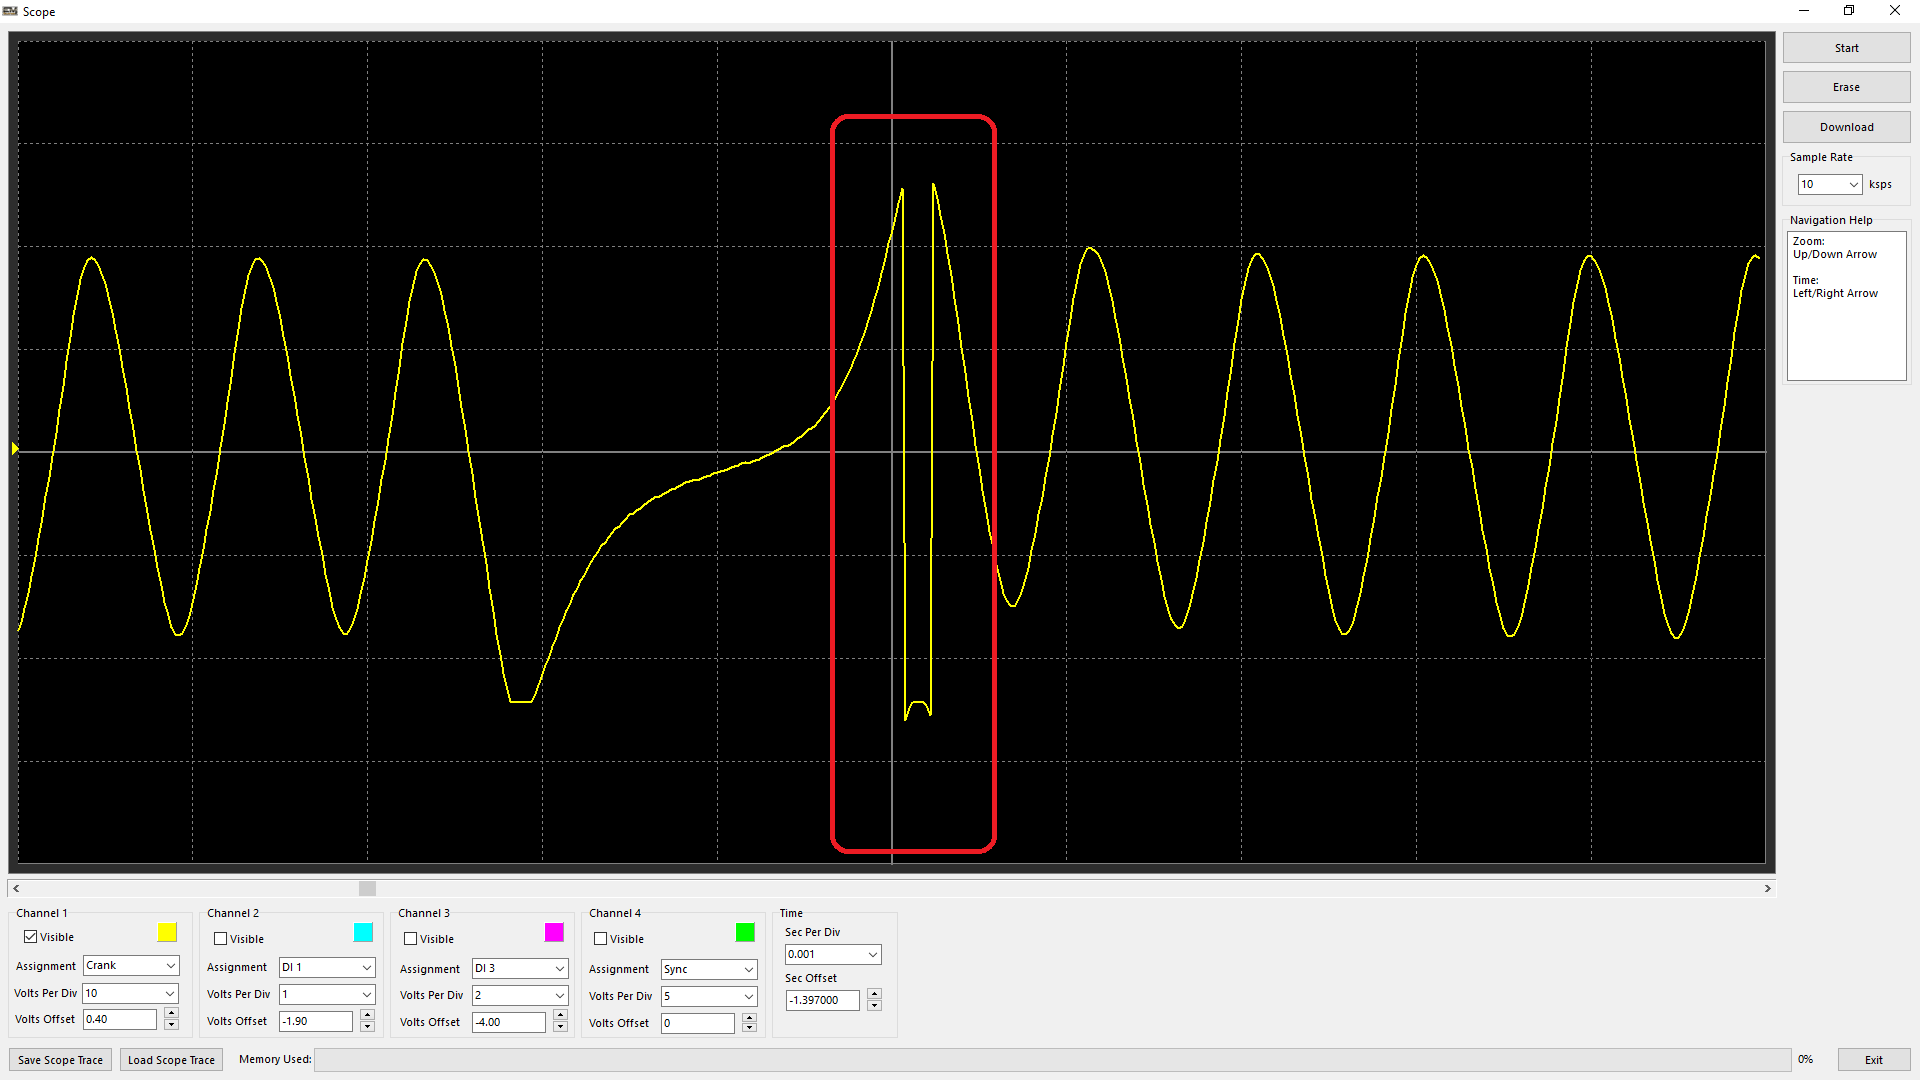
Above is an example of the scope “clipping” over its 25v limit.
This is normal and should not be considered an error in signal.
If signals need to be measured reliably beyond +/-25v, then an external scope tool must be used.
Troubleshooting Trigger Errors
There are several runtimes the ECU generates to diagnose/validate triggers the ECU is using. You can see these runtimes live under:
F3 Runtimes > Triggers/Limits, Engine Decoding/Engine Decoding Status
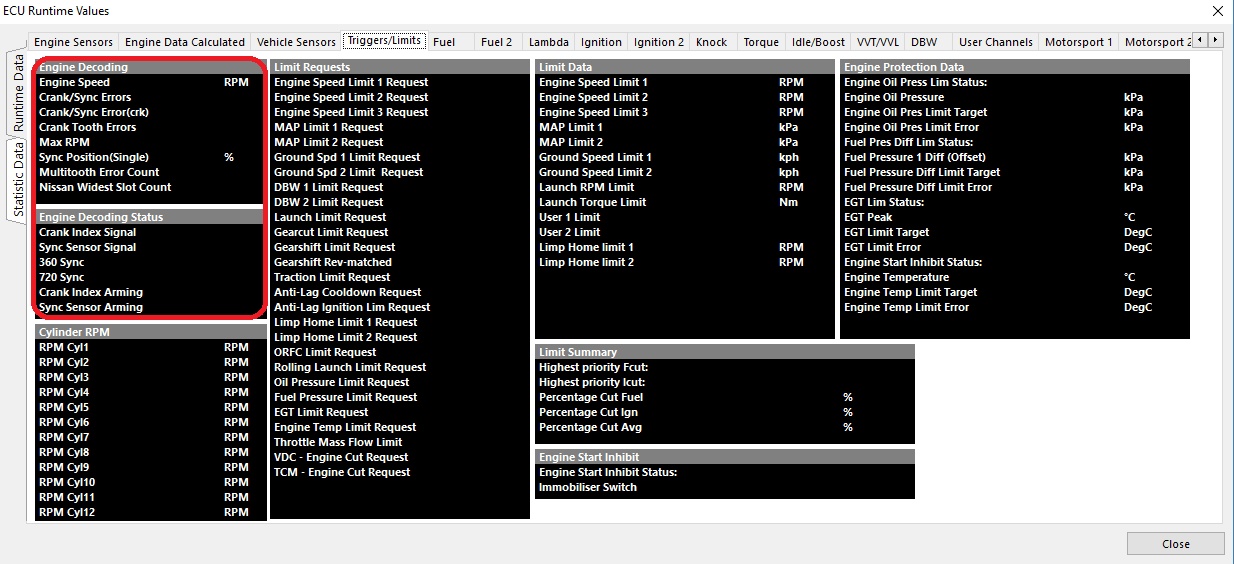
Green runtimes simply are notifications that there is a “signal” present on these inputs. They do not signify if the signals are valid.