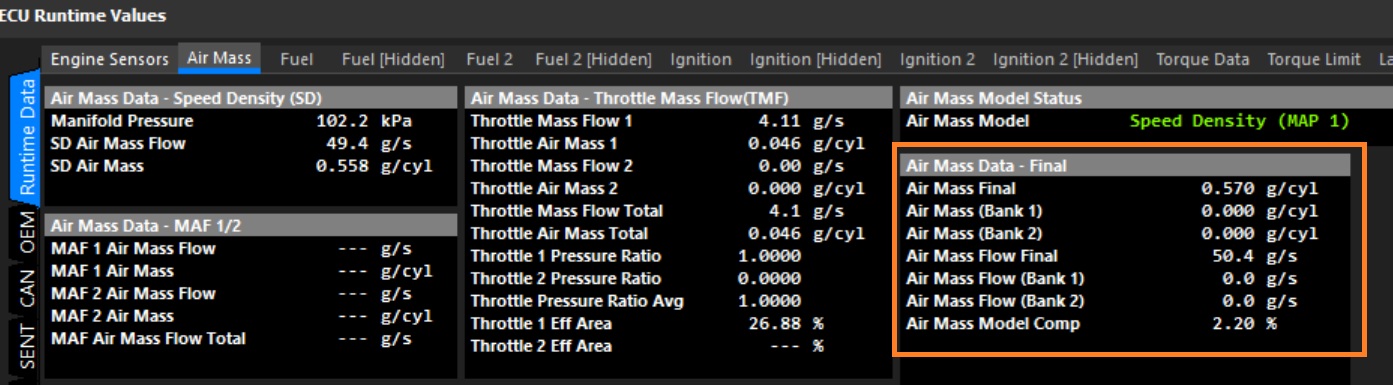
The Air Mass Model Compensation applies a percentage adjustment to the calculated Final Air Mass. The resulting Air Mass Final value can be viewed in F3 Runtime → Air Mass. The Air Mass Model Comp (%) value applied to the calculation is also displayed here.
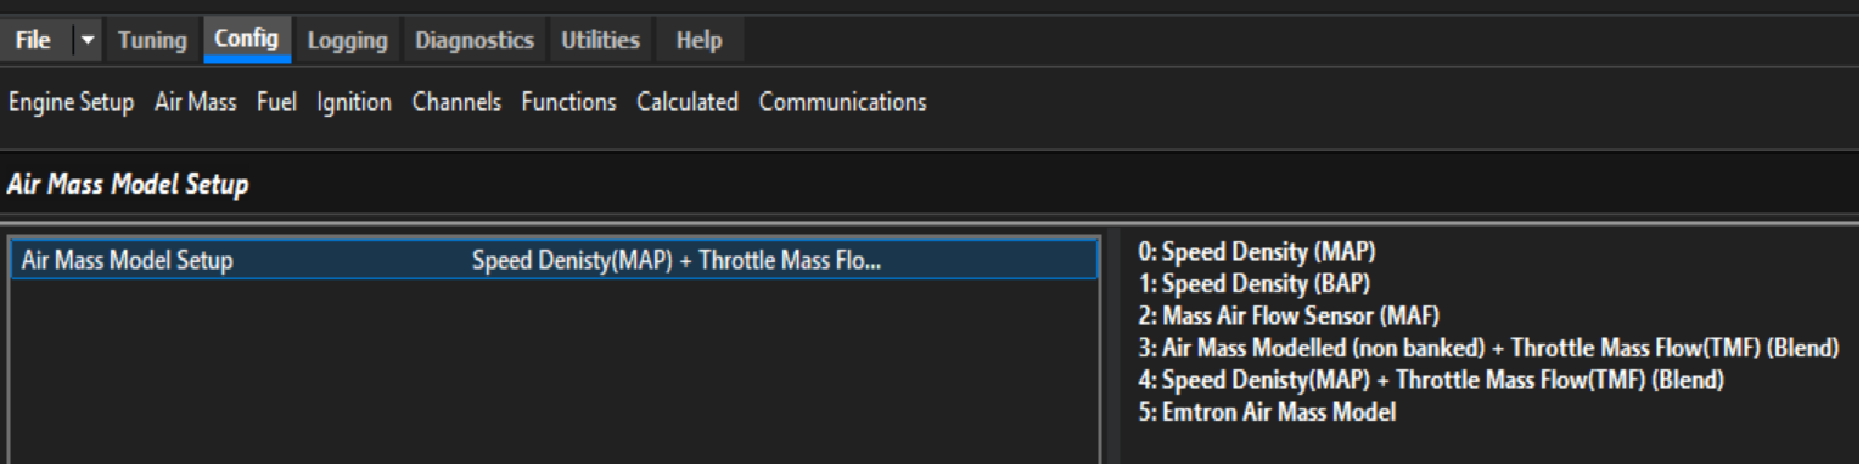
The Air Mass Model Compensation function is enabled from Config → Air Mass → Air Mass Model Setup.
In the example below, Speed Density calculates an Air Mass of 0.558 g/cyl. A 2.20% compensation is then applied, resulting in a Air Mass Final of 0.570 g/cyl.
This 3D table can be used to compensate for engine operating conditions that are not fully represented by the selected Air Mass Model, improving air mass accuracy across the operating range.
The compensation is applied AFTER the primary air mass calculation has been completed.
0.0% = No compensation applied
Positive values = Increase calculated air mass
Negative values = Decrease calculated air mass
Note:
The Air Mass Compensation Table should not be used to compensate for incorrect VE calibration or sensor scaling errors. These should be corrected at their source wherever possible.
The X and Y axes of the Air Mass Comp Table are fully configurable and may be assigned to any suitable ECU runtime. This allows the compensation to be tailored to the specific engine and application.
Units: Air Mass Flow is expressed in units of g/s (grams per second), while Air Mass is expressed in units of g/cyl (grams per cylinder), representing the mass of air trapped in the cylinder during a single engine cycle
Air Mass Model Blend Table
Background
The Air Mass Model defines how the ECU calculates the mass of air entering the engine. The calculated air mass is then used to determine the required fuel mass to achieve the commanded Lambda Target, before being converted into an injector pulse width using the configured injector characteristics.
Different engine combinations may benefit from different air mass calculation strategies. Emtron provides several Air Mass Models to suit a wide range of applications.
Options
Value
Air Mass Model
0
Speed Density (MAP)
1
Speed Density (BAP)
2
Mass Air Flow (MAF)
3
Air Mass Modelled + Throttle Mass Flow (TMF) Blend
4
Speed Density (MAP) + Throttle Mass Flow (TMF) Blend
5
Emtron Air Mass Model (Custom)
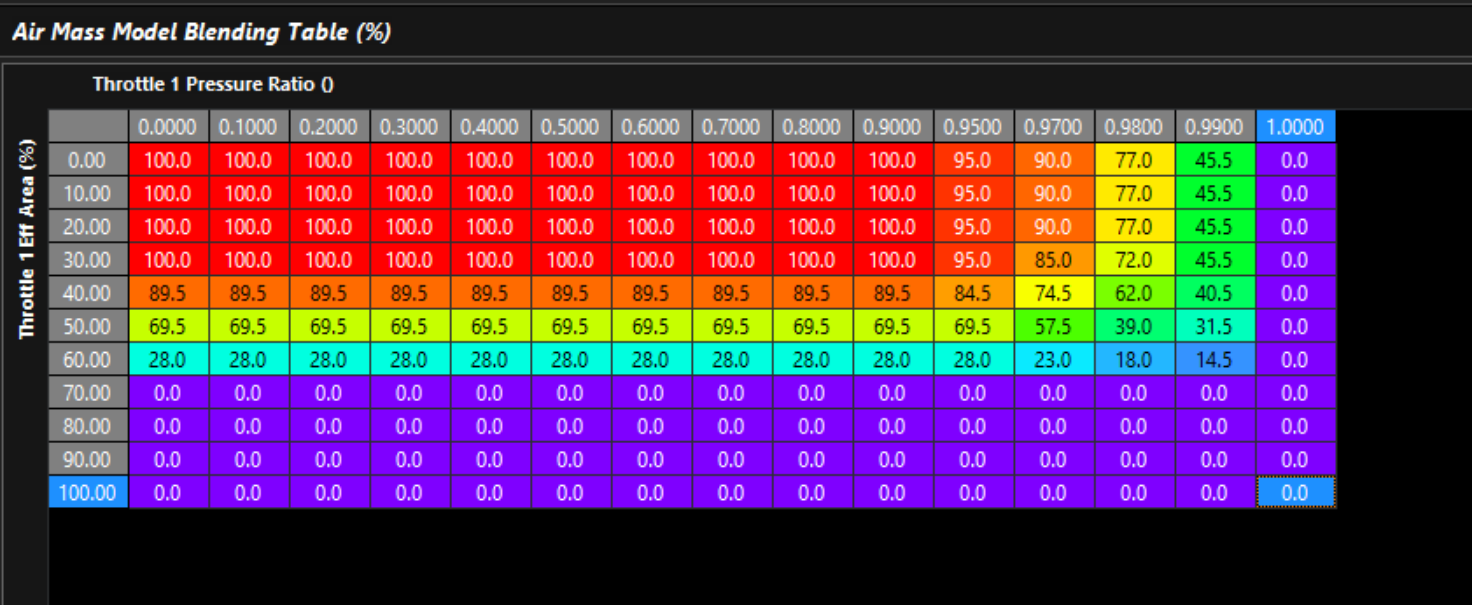
When Air Mass Model 3, 4 or 5 is selected, the Air Mass Blend Table becomes active. The Air Mass Blend Table is a three-dimensional calibration table that determines the contribution of each selected Air Mass Model to the final calculated engine air mass.
The table output is expressed as a percentage, where:
0% = 100% Primary Air Mass Model
100% = 100% Secondary Air Mass Model
Intermediate values proportionally blend the two Air Mass Models.
This allows the ECU to transition smoothly between two air mass calculation methods as engine operating conditions change, combining the advantages of each model over different areas of the operating range.
Air Mass Modelled + Throttle Mass Flow (TMF) Blend
(Option 3)
0.0% → 100% Air Mass Modelled
50.0% → Equal blend of both models
100.0% → 100% Throttle Mass Flow (TMF)
Speed Density (MAP) + Throttle Mass Flow (TMF) Blend
(Option 4)
0.0% → 100% Speed Density (MAP)
50.0% → Equal blend of both models
100.0% → 100% Throttle Mass Flow (TMF)
Emtron Air Mass Model
(Option 5)
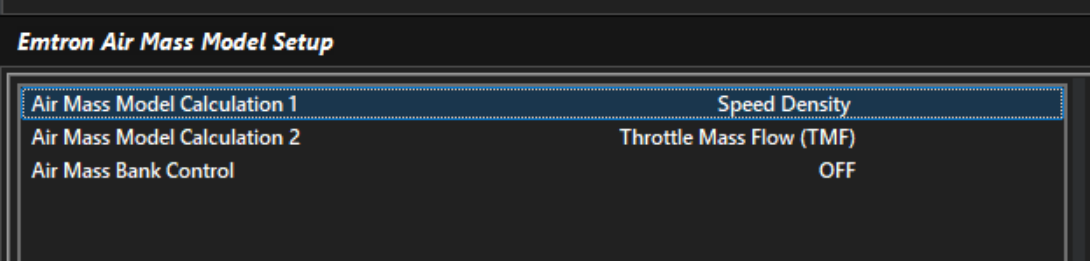
0.0% → 100% **Calculation 1
50.0% → Equal blend of both models
100.0% → 100% **Calculation 2
Note
The X and Y axes of the Air Mass Blend Table are fully configurable and may be assigned to any suitable ECU runtime. This allows the blend ratio to be tailored to the specific engine and application.
Manifold Pressure Estimate Table
Overview
The Manifold Pressure Estimate calculates a theoretical manifold pressure independently of the measured Manifold Pressure (MAP) sensor.
The calculated pressure can be used in several applications:
MAP Sensor Fallback – The estimated manifold pressure can be used as a fallback when a MAP sensor fault is detected.
Transient Air Mass Calculation – The estimated manifold pressure can be blended with the measured MAP during high transient conditions. This can improve the air mass calculation response and reduce the reliance on Acceleration Enrichment.
Individual Throttle Body (ITB) Applications – The estimated manifold pressure can be used as a calculated MAP source on engines where a conventional MAP sensor is not fitted or where the MAP signal is unreliable.
Note
The X and Y axes of this Table are fully configurable and may be assigned to any suitable ECU runtime.
Exhaust Pressure Estimate Table
Overview
The Exhaust Pressure Estimate calculates a theoretical exhaust manifold pressure independently of an Exhaust Manifold Pressure (EMAP) sensor. This allows the VE Expansion Ratio correction to operate without relying on a continuously measured EMAP signal.
Due to the harsh operating environment of an EMAP sensor, sensor failures can occur. The EMAP Estimation Table can be filled with measured exhaust pressure data and then used as an alternative pressure source.
Once calibrated, the estimated exhaust pressure can be used as a fallback in the event of an EMAP sensor failure, allowing the VE Expansion Ratio correction to continue operating.
Note
The X and Y axes of this Table are fully configurable and may be assigned to any suitable ECU runtime.
The fueling calculations used by Emtron are based on an Air Mass per cycle which is then converted to a Fuel Mass based on the requested lambda target. This is true whether the system is using directly measuring airflow from the air mass meter, or calculated air mass from speed density or throttle mass flow (TMF)
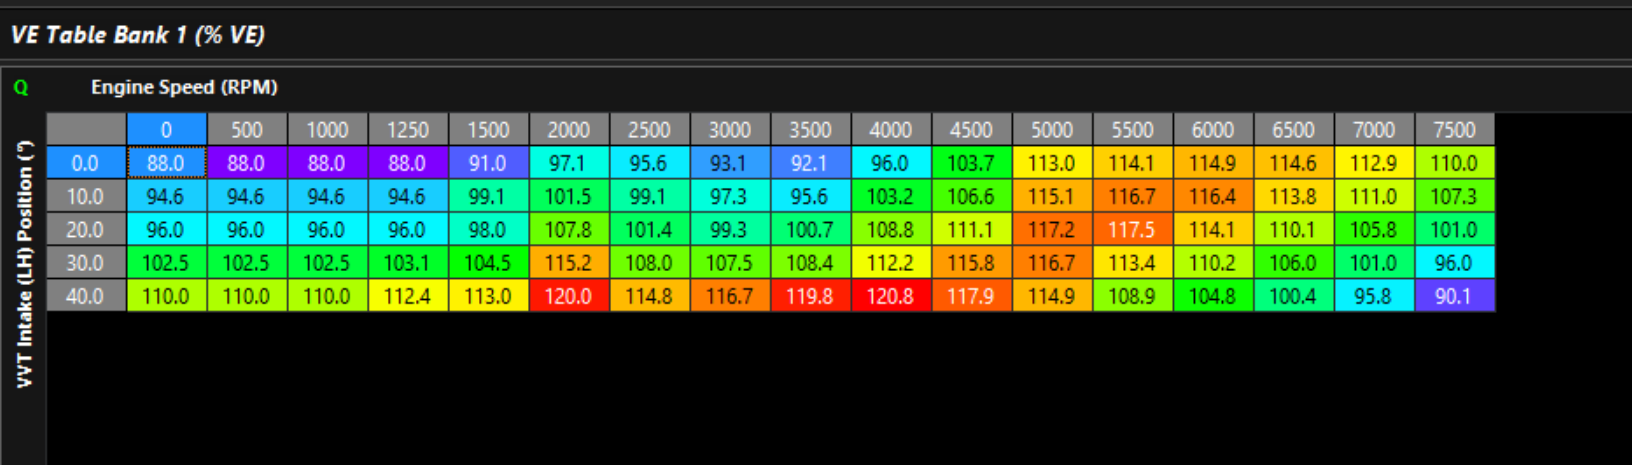
The Volumetric Efficiency (VE) table is used when the Air Mass Model is configured for Speed Density.
In Speed Density mode, the ECU does not directly measure the engine airflow. Instead, it calculates the air mass entering each cylinder using the Ideal Gas Law based on:
Engine Displacement
Manifold Absolute Pressure (MAP)
Charge Temperature
Volumetric Efficiency (VE)
The calculated Air Mass per Engine Cycle is then used to determine the required Fuel Mass based on the commanded Lambda Target. The ECU then converts the required fuel mass into an injector pulse width using the configured injector characteristics.
ℹ️ Note
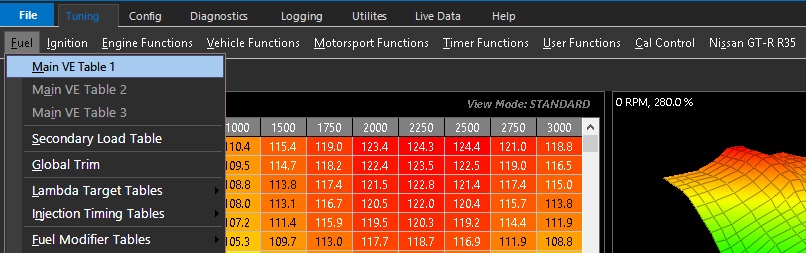
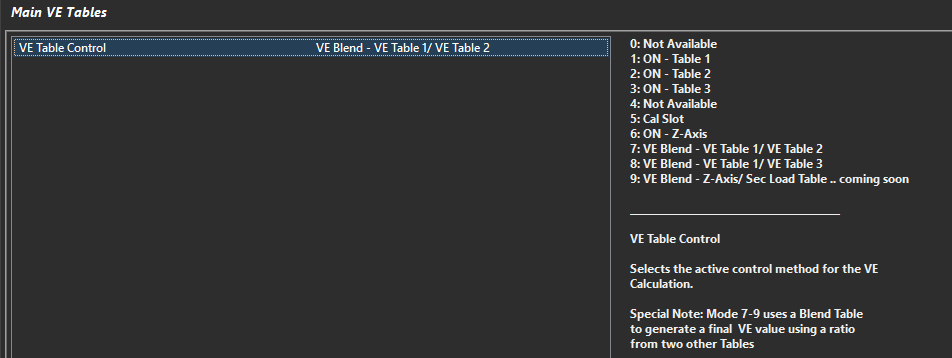
The ECU supports one or two Volumetric Efficiency (VE) tables. The active table configuration is selected using the VE Table Control setting, which determines whether a single VE table is used or whether blending between two VE tables is enabled (Z- Axis).
Volumetric Efficiency (VE) Table
The Volumetric Efficiency (VE) table represents the engine’s ability to fill its cylinders with air under varying engine speeds and loads.
Although referred to as Volumetric Efficiency (VE), the ECU uses VE to determine the air mass trapped within the cylinder. VE is expressed as a percentage and represents the ratio of the actual air mass trapped within the cylinder to the theoretical air mass that would occupy the engine’s swept cylinder volume under standard atmospheric conditions.
The calculated air mass is then used by the ECU to determine the required fuel mass to achieve the commanded Lambda Target.
A higher VE indicates the engine is filling its cylinders more efficiently, requiring more fuel to maintain the commanded Lambda Target.
Most engines typically operate below 100% VE.
ℹ️ Note
The term Volumetric Efficiency is historical and can be misleading. While VE is expressed as a percentage of the cylinder’s theoretical filling, the ECU ultimately uses the VE value to calculate the air mass entering the cylinder. Since fuel delivery is based on air mass rather than air volume, VE is simply a convenient way of modelling the engine’s air pumping efficiency.
Due to intake and exhaust tuning, pressure wave dynamics and scavenging effects, a well-designed naturally aspirated engine can exceed 100% VE over parts of its operating range.
Tuning
Before calibrating the VE table(s), the Lambda Target table(s) should first be configured with the desired lambda or air-fuel ratio for each operating condition.
Once the Lambda Target table(s) have been calibrated, the VE table is adjusted until the measured lambda matches the commanded Lambda Target. The two tables are intrinsically linked, the Lambda Target defines the desired result, while the VE table determines the amount of fuel required to achieve it.
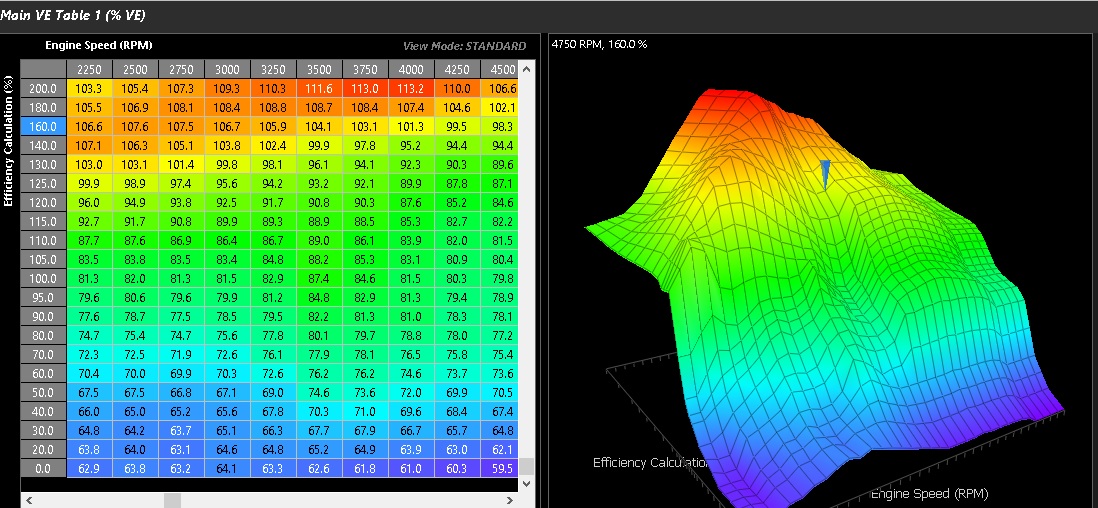
The above VE table example shows the typical range of values.
🔧Tuning Notes
The VE table is calibrated by adjusting its values until the measured lambda matches the commanded Lambda Target across the engine’s operating range.
This process is most efficient when the ECU is configured with a Wideband Lambda input, allowing the measured lambda to be compared directly with the commanded target.
Once the VE table has been correctly calibrated, the engine’s volumetric efficiency model has been established, providing an accurate basis for fuel delivery calculations.
The objective is to minimise the error between the measured lambda and the Lambda Target under all operating conditions.
A simple method of validating the VE calibration is to change the Lambda Target at a specific operating point. If the VE table and injector characterization have been calibrated correctly, the measured lambda should follow the new Lambda Target without requiring further VE adjustments.
If changes to the VE table are required to achieve the new Lambda Target, this may indicate an error in the VE calibration or the configured injector characterization (injector flow, deadtime, or non-linearity).
When Closed Loop Lambda Control is enabled, the VE table provides the feed-forward fuel calculation, while the closed loop controller applies only the corrections necessary to eliminate any remaining fueling error.
VE Table Control
This control determines whether a single target table is used or whether Z-axis blending is enabled between two calibration tables.
Available Options
Value
Mode
0
OFF
1
ON - Table 1
2
ON - Table 2
3
Not Available
4
Not Available
5
Cal Slot
6
ON - Z-Axis
Mode Descriptions
OFF (0)
Disables the Lambda Target table input
ON - Table 1 (1)
Uses VE Table 1 only for air masss speed density model
ON - Table 2 (2)
Uses VE Table 2 only for air masss speed density model
Not Available (3–4)
Reserved for future functionality and should not be selected.
Cal Slot (5)
Enables real-time switching of the Fuel VE tables via calibration slot selection.
This allows the ECU to switch between pre-defined calibration sets without modifying the Table Control setting. See Tuning view -> Cal Control menu
Dual VE tables are particularly useful for engines with significantly different airflow characteristics between operating modes. For example, on a Honda VTEC engine, one VE table can be calibrated for the low-lift cam profile and the second VE table calibrated for the high-lift cam profile. Once both tables have been tuned across the full operating range, the VTEC changeover point can be adjusted to determine the optimum switching RPM without requiring the VE calibration to be retuned.>
Example application:
Table 1 = VTEC Low-lift Cam
Table 1 = VTEC high-lift Cam
The active table can be switched in real time based on RPM or a user defined switch condition
ON - Z-Axis (6)
The Z-Axis enables a user-defined third axis used to swap or blend between VE Table 1 and VE Table 2.
The ECU performs real-time linear interpolation between both VE tables based on the configured Z-Axis input. This allows fuel delivery to be dynamically adjusted across a third operating dimension, which can be spanned using any available runtime parameter within the ECU.
0% Z-axis → 100% Table 1
100% Z-axis → 100% Table 2
Intermediate values → linear interpolation between both tables
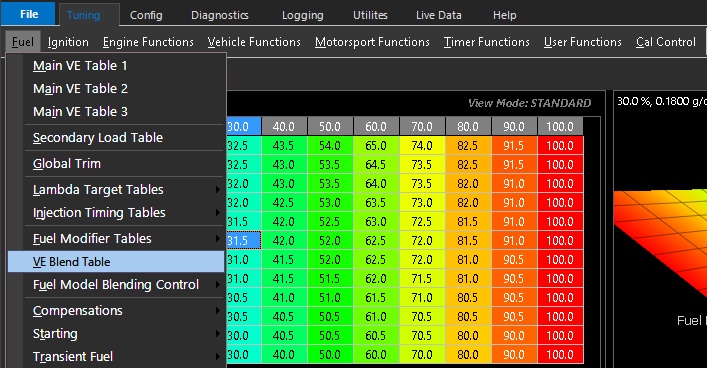
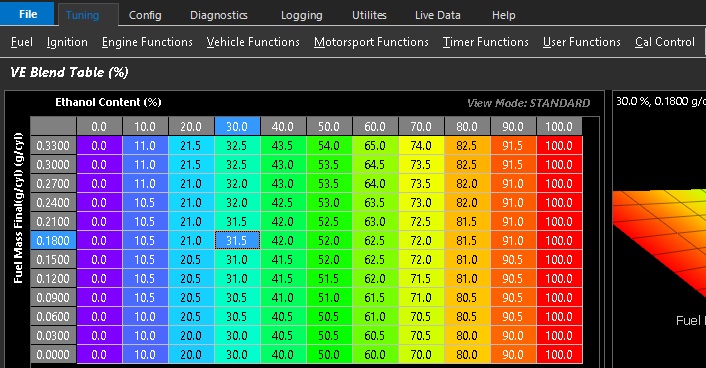
VE Blend Table can be enabled under Fuel Table Control :
Tuning -> Fuel -> Fuel Table Control
VE Blend can blend only two VE tables at a time.
Units are 0-100%
0% = First VE Table
100% = Second VE Table
Global Fuel Trim
This function applies a global fuel trim to the base calibration.
It provides a percentage-based adjustment to injector pulse width, allowing the overall air-fuel ratio to be shifted richer or leaner without modifying individual fuel tables.
The trim is applied uniformly across all operating conditions and is independent of engine speed (RPM) and load.
Applied globally to all fuel calculations derived from the base calibration
⚠️ Notes
This function is intended as a calibration and setup aid only.
It allows for a rapid changes to the overall mixture and works independent of RPM and load.
This trim should be returned to 0% before final tuning to ensure the base fuel model is accurate and consistent.
Lambda Target Tables
Overview
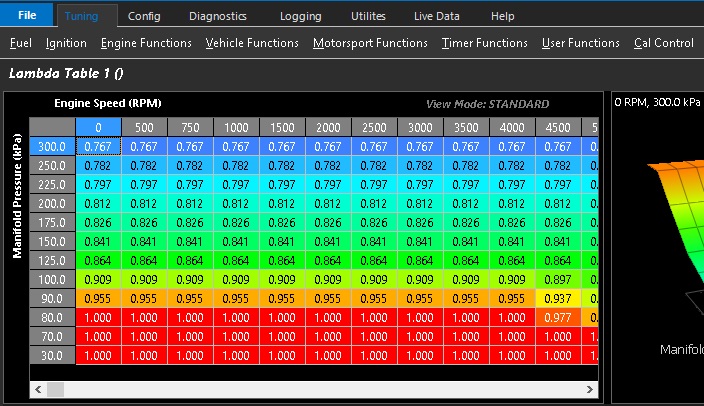
The Lambda Target table enables the user to define the desired Lambda target across the operating range of the engine.
The Lambda Target is a primary input to the ECU airflow and fuel model and therefore directly influences the final calculated fuel mass injected into the engine.
Once the Engine VE (Volumetric Efficiency) table is correctly calibrated to achieve the commanded Lambda Target, the engine’s operating Lambda can be adjusted simply by changing the Lambda Target value, without requiring changes to the main fuel calibration.
This target must be defined prior to the calibration of the VE table(s).
For example, if the Main Fuel Table is calibrated such that the engine operates at 1.00 Lambda when the Lambda Target is 1.00, then reducing the Lambda Target to 0.80 will result in the ECU automatically increasing fuel delivery to achieve 0.80 Lambda, without any changes to the Main Fuel Table.
Note: If a change in Lambda Target (e.g. from 1.00 to 0.80) does not result in the measured Lambda matching the target, this indicates an error in the fuel system model, most commonly incorrect injector characterisation which should be corrected before continuing.
Why Lambda is used instead of AFR
Lambda is used as the primary combustion target because it represents the relative air–fuel ratio to stoichiometric, rather than an absolute fuel value.
Since different fuels have different stoichiometric air–fuel ratios, the same AFR value does not represent the same combustion condition across fuels. For example, petrol, ethanol blends, and methanol all require different AFR values to achieve the same combustion state.
Lambda removes this dependency by normalising the mixture to stoichiometric:
Lambda = 1.00 → stoichiometric combustion (regardless of fuel type)
Lambda < 1.00 → rich mixture
Lambda > 1.00 → lean mixture
Because of this, a single Lambda Target can be used across all fuels, while the equivalent AFR target would change depending on fuel composition.
This allows calibration to remain consistent when fuel type changes, while still maintaining the same combustion behaviour.
For this reason, Lambda Targets are preferred over AFR Targets in the ECU fuel model, as they provide a universal reference independent of fuel stoichiometry.
Lambda Target Tables
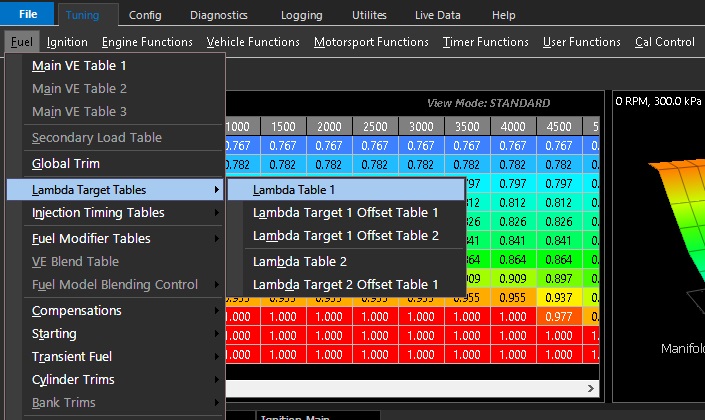
Two Lambda Target tables are available within the ECU. Either table can be used to define the engine’s Lambda target across the operating range.
The active table is selected using the Lambda Target Table Control setting.
Only the selected (active) table is used by the ECU for fuel model calculations and closed-loop control. The inactive table has no effect on engine operation until it is selected as the active source.
Normally Lambda Target Table 1 is used.
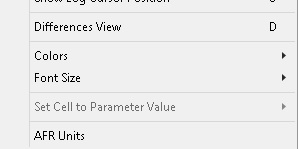
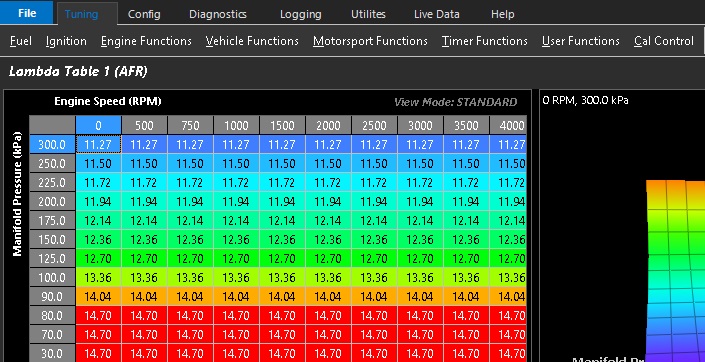
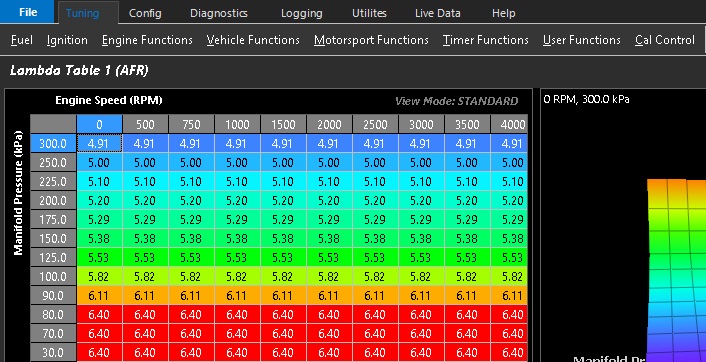
Should an actual Air Fuel Ratio be required to be displayed, this can be achieved by right mouse click on table and selecting AFR Unit . Once activated, if the fuel model is set to a single fuel type, the Lambda Table 1 will be displayed in regular AFR units.
⚠️ Warning:
This feature will not work with flex or dual fuel models - see Stoich Ratio Setup
Example 1: Gasoline fuel AFR shown
Example 2: Methanol fuel AFR shown
Lambda Target Offset Table
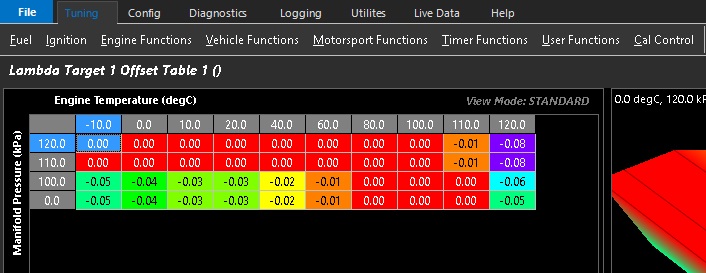
The Lambda Target Offset is applied as an absolute correction to the base Lambda Target defined in the Lambda Target table.
For example, if the Lambda Target table value is 1.000 and a Lambda Target Offset of -0.150 Lambda is applied, the resulting effective Lambda Target becomes:
1.000 + (-0.150) = 0.850
This offset is absolute (not percentage-based) and directly adds or subtracts from the base Lambda Target value.
It allows the final Lambda Target to be adjusted dynamically without modifying the base calibration table.
This control determines whether a single target table is used or whether Z-axis blending is enabled between two calibration tables.
Available Options
Value
Mode
0
OFF
1
ON - Table 1
2
ON - Table 2
3
Not Available
4
Not Available
5
Cal Slot
6
ON - Z-Axis
Mode Descriptions
OFF (0)
Disables the Lambda Target table input
ON - Table 1 (1)
Uses Table 1 only for Lambda Target calculation.
Typically represents the base calibration (e.g. Petrol Lambda Target strategy).
ON - Table 2 (2)
Uses Table 2 only for Lambda Target calculation.
Typically represents an alternative calibration strategy (e.g. Methanol or high-load enrichment strategy).
Not Available (3–4)
Reserved for future functionality and should not be selected.
Cal Slot (5)
Enables real-time switching of the active Lambda Target table via calibration slot selection.
This allows the ECU to switch between pre-defined calibration sets without modifying the Table Control setting. See Tuning view -> Cal Control menu
Example application:
Table 1 = Petrol Lambda Target calibration
Table 2 = Methanol Lambda Target calibration
The active table can be switched in real time depending on:
Fuel type
Engine mode
Test or development configuration
This mode is commonly used for:
Rapid calibration comparison
Track-side strategy changes
Different Fuel system
ON - Z-Axis (6)
Enables Z-axis blending between Table 1 and Table 2.
The ECU interpolates between both tables based on the configured Z-axis input (typically Ethanol Content %), producing a blended fuel value.
0% Z-axis → 100% Table 1
100% Z-axis → 100% Table 2
Intermediate values → linear interpolation between both tables
Z-Axis Blended (Dual Table Interpolation)
The ECU supports a Z-axis blending strategy that allows lambda targets to be interpolated between two tables based on a third operating axis.
Concept Overview
Two base Lambda Target tables are defined:
Table 1 (Reference Fuel – Petrol) Defines Lambda Targets for standard petrol operation.
Table 2 (Alternative Fuel – High Oxygen Content Fuel) Defines Lambda Targets for high ethanol or methanol operation.
A Z-axis input (typically fuel composition such as ethanol content) is used to interpolate between the two tables.
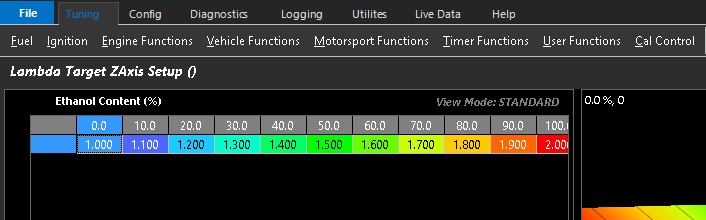
This example shows the blend between Table 1 and Table 1 spanned on the Z-axis using Ethanol content
Injection Timing
⚙️ Injection Timing Table
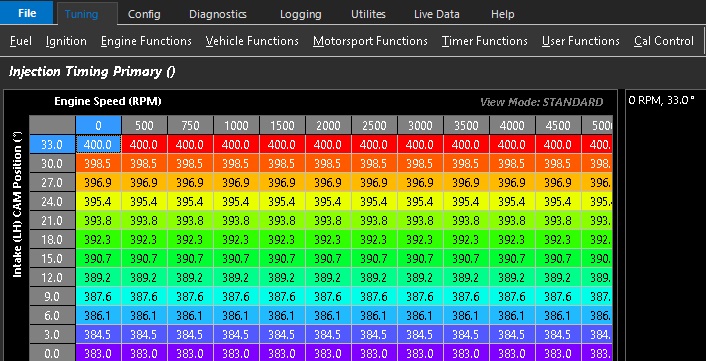
The Injection Timing table defines the desired injection event angle as a function of engine operating conditions.
Table values are expressed in crankshaft degrees Before Top Dead Centre (BTDC) and are referenced to Cylinder 1 Compression TDC (i.e 400 = 400 degrees before TDC Cylinder 1 compression). The table is configured as an advance-style table, therefore larger values schedule the injection event earlier in the engine cycle.
The interpretation of the table values depends on the selected Injection Timing Reference mode:
Start of Injection – Table values define when the injector begins delivering fuel. End of Injection – Table values define when the injector finishes delivering fuel.
Table Size: 22 columns x 12 rows
Resolution: 0.1 Deg Range: 0.0 - 720.0 Degs
⚠️ Notes
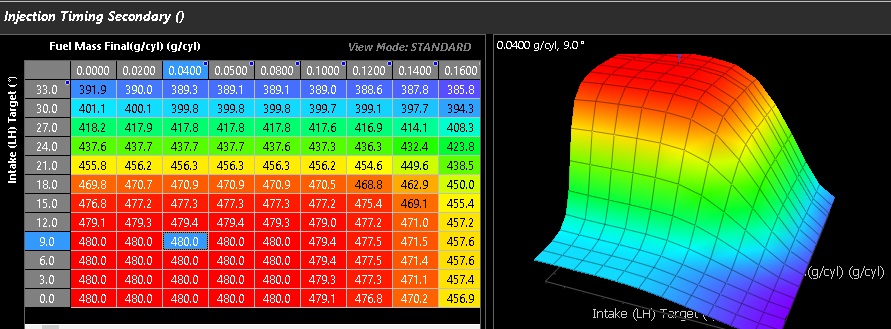
When Staged Injection is enabled, a secondary Injection Timng Table can be used which operates independently of the Primary Injectors. The Sec Injectors can be advanced up during the initial transition into staged mode to help improve the overall smoothness during this event
⚙️ Injection Timing Reference
The Injection Timing Reference setting determines whether the Injection Timing table values specify the Start of Injection (SOI) or End of Injection (EOI) event.
Injection Timing determines when fuel is delivered into the engine cycle relative to Cylinder 1 Compression Top Dead Centre (TDC).
Injection Timing values are expressed in crankshaft degrees Before Top Dead Centre (BTDC) . Larger values schedule the injection event earlier in the engine cycle.
Timing Reference Examples
Value
Description
400° BTDC
400° before Cylinder 1 Compression TDC
360° BTDC
TDC between the exhaust and intake strokes (valve overlap period)
300° BTDC
Approximately 60° after intake valve opening on a typical 4-stroke engine
Options
Value
Mode
0
Start of Injection
1
End of Injection
Start of Injection (SOI)
The Injection Timing table value defines when the injector begins delivering fuel.
The ECU calculates the corresponding End of Injection based on the injector pulse width and operating conditions.
This mode is typically used when the desired fuel delivery strategy is based on the opening point of the injection event.
End of Injection (EOI)
The Injection Timing table value defines when the injector finishes delivering fuel.
The ECU automatically calculates the corresponding Start of Injection based on the injector pulse width and operating conditions.
This mode is commonly used when precise control of fuel delivery relative to intake valve events is required.
For sequential injection systems, End of Injection mode is often preferred because the completion of fuel delivery can be aligned with intake valve events. This can reduce fuel wall wetting, improve fuel preparation and promote more consistent cylinder-to-cylinder fuel distribution.
⚠️ Notes
Injection timing values are referenced to Cylinder 1 Compression TDC regardless of the cylinder being fuelled.
Higher values move the injection event earlier in the engine cycle.
Whether the value represents the Start or End of Injection depends on the selected Injection Timing Reference mode.
The actual injector opening and closing points will vary with pulse width, engine speed and operating conditions.
Example for Staged Injection with the angle spanned across intake camshaft target angle & fuel mass final (g/cyl).
Starting Fuel Setup
Starting Fuel Overview
Engine starting fuel requirements differ significantly from those required during normal engine operation. At low engine speeds and temperatures, a portion of the injected fuel does not immediately contribute to combustion as it can condense on intake surfaces, intake valves and cylinder walls. Additional fuel compensation is therefore required to ensure sufficient combustible fuel reaches the cylinder during the starting process.
The starting fuel strategy consists of three distinct phases:
Phase 1 – Pre-Crank Fuel
Pre-crank fuel is delivered before or at the beginning of engine cranking. The purpose of this fuel is to establish an initial fuel film on the intake port and valve surfaces, reducing the amount of fuel lost to wall wetting during the first combustion events.
Correctly calibrated pre-crank fuel can improve start quality, reduce cranking time and promote faster engine burst.
Phase 2 – Cranking Fuel
During cranking additional fuel enrichment is required to compensate for fuel condensation and poor fuel vaporisation, particularly at lower engine and ambient temperatures.
Cranking fuel provides the additional fuel necessary to achieve a combustible air-fuel mixture while the engine is rotating below its self-sustaining speed. Fuel requirements during this phase are highly dependent on coolant temperature, fuel characteristics, engine design and injector placement.
Phase 3 – Post-Start Fuel
Once the engine has fired and transitioned from cranking to running, additional fuel compensation is typically required for a short period. The Fuel films established during the starting process continues to evolve and combustion stability may not yet be fully established.
Post-start fuel provides a temporary enrichment immediately after engine burst and gradually decays over time. This ensures a smooth transition from starting operation to normal fuel calculations while maintaining stable combustion and drivability. As the post-start compensation decays to zero, fueling returns entirely to the standard operating fuel model with no additional start-related compensation applied.
⚙️ Pre-Crank Fuel Enable
Enables and configures a pre-crank fuel injection event. This feature can improve engine start-up by providing an initial fuel charge before or during cranking, helping the engine fire more quickly.
Options
Value
Mode
0
Off
1
Start Position
2
First Crank Index Signal (Single Event)
3
Key On
4
First Crank Index Signal (Multiple Events)
Mode Descriptions
Off
Disables all pre-crank injection events.
Start Position
Triggers a pre-crank injection event when the configured Start Position Switch becomes active. The Start Position Switch must be configured for this mode to operate.
First Crank Index Signal (Single Event)
Triggers a single pre-crank injection event when the first crank index signal is detected after ECU power-up.
Key On
Triggers a single pre-crank injection event when the ignition is switched to the ON position after ECU power-up.
First Crank Index Signal (Multiple Events)
Triggers the pre-crank injection event on the first crank index signal detected during engine cranking. Unlike the other modes, this mode automatically re-arms after the engine has stopped, allowing the pre-crank injection event to occur again on subsequent start attempts without requiring an ECU power cycle. To prevent repeated pre-crank injection events during unsuccessful starts or engine stalls, a lockout mechanism is applied. Before another pre-crank event can occur, the engine re-arming conditions must be met:
Exceed 400 RPM. Remain above 400 RPM for at least 1 second.
Once these conditions have been satisfied and engine speed subsequently returns to 0 RPM, the pre-crank injection event will be re-enabled and available for the next engine start.
⚠️ Notes
Modes 1, 2 and 3 perform only a single pre-crank injection event after ECU power-up. The ECU power must be cycled before another pre-crank injection event can occur using the Modes.
Mode 4 the pre-crank event can be re-triggered automatically once the re-arming conditions have been met.
⚙️ Pre-Crank Pulse Count
Sets the number of fuel injection pulses during the pre-crank priming event. Using multiple shorter pulses helps improve fuel atomisation and distribution while reducing the risk of liquid fuel accumulation.
Increasing the pulse count can be beneficial when using fuels that require significantly more fuel for cold starting, such as ethanol-based fuels. Rather than using a single large injection pulse, the required fuel can be distributed across multiple smaller pulses.
This approach can improve fuel atomisation and reduce the likelihood of fuel pooling or entering the cylinder in a liquid state, which can lead to spark plug wetting and poor starting performance.
Typical Applications:
Ethanol and high-ethanol-content fuels.
Engines requiring large amounts of pre-crank fuel.
Situations where a single large pulse results in poor start quality.
⚙️ Pre-Crank Pulse Interval
Sets the time delay between consecutive pre-crank injection pulses. This parameter only applies when Pre-Crank Pulse Count is greater than 1.
It controls the spacing between each injection pulse during the pre-crank event, allowing adjustment of fuel delivery timing and mixture preparation.
Short interval: higher fuel density, increased wetting risk.
Long interval: improved atomisation, reduced total delivery rate.
The interval should be long enough to allow fuel from each pulse to disperse and form a stable fuel film before the next pulse is delivered. Excessively short intervals may reduce the benefit of using multiple pulses, while excessively long intervals can unnecessarily delay the start sequence.
🔧 Tuning Guidelines
When additional pre-crank fuel is required, it is generally preferable to increase the Pre-Crank Pulse Count rather than significantly increasing the fuel delivered in a single pulse.
A good starting point is:
Set Pre-Crank Multi Pulse Interval to approximately 10 ms.
Increase Pre-Crank Pulse Count by one pulse at a time.
Evaluate cold start performance after each adjustment.
Continue increasing the pulse count until no further improvement in start quality is observed.
Typical applications require between 1 and 6 pulses, with higher pulse counts generally only required for ethanol-based fuels or engines requiring large amounts of pre-crank fuel.
Pre-crank fuel is used to establish an initial fuel film on the intake port and valve surfaces before the engine begins cranking. This helps compensate for fuel that would otherwise be lost to wall wetting during the first combustion events, improving engine start quality and reducing cranking time.
Pre-crank fuel is calibrated using a three-dimensional Pre-Crank Fuel Table. The table allows the amount of fuel delivered during each pre-crank injection event to be varied over two configurable operating axes, providing flexibility for different engine and fuel combinations.
In most applications, the table is configured as a function of Engine Coolant Temperature only (effectively operating as a 2D table), with colder engine temperatures requiring greater pre-crank fuel.
The fuel quantity defined in this table is applied whenever a pre-crank injection event is triggered via the Pre-Crank Injection Mode setting .
🔧 Tuning Guidelines
Increase fuel values if the engine requires excessive cranking before firing.
Increase fuel values if the engine struggles to fire during cold starts.
Decrease fuel values if the engine exhibits signs of flooding, spark plug wetting, or excessively rich starts.
Ethanol-based fuels typically require significantly more pre-crank fuel than gasoline-based fuels.
Large increases in fuel quantity are often better achieved using multiple pulses rather than a single large pulse. Refer to Pre-Crank Pulse Count and Pre-Crank Multi-Pulse Interval for additional tuning options.
⚠️ Important Notes
Excessive pre-crank fuel can result in spark plug wetting and poor start quality.
The optimum fuel quantity will vary depending on fuel type, injector location, engine design, and ambient temperature.
Pre-crank fuel should be used to improve initial combustion quality, not to compensate for incorrectly calibrated cranking fuel.
During cranking, engine speed is low and fuel atomisation is poor. Additional fuel is required to compensate for fuel condensation on intake and cylinder surfaces and to ensure a combustible air-fuel mixture.
Cranking fuel is calibrated using one or two three-dimensional Cranking Fuel Tables. Each table allows the amount of fuel delivered during the cranking injection event to be varied over two configurable operating axes, providing precise control over cranking fuel under different starting conditions.
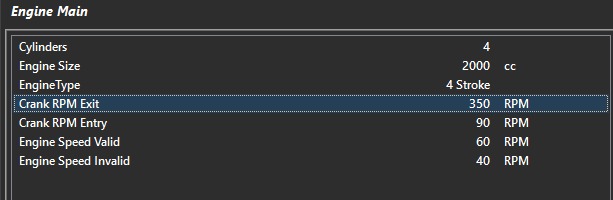
The cranking threshold is defined when the engine speed is below the configured Crank Exit RPM setting.
The Crank Fuel Table is typically configured as a function of coolant temperature and firing events ; the colder engine temperatures requiring greater fuel enrichment.
Fuel from this table is applied continuously while the engine remains in the cranking state.
🔧 Tuning Guidelines
Increase fuel values if the engine struggles to fire or requires excessive cranking time.
Decrease fuel values if the engine exhibits signs of flooding.
Cold temperature regions generally require significantly more fuel than warm temperature regions.
Post-Start Fuel Table
The Post-Start Fuel Table provides temporary fuel enrichment immediately after the engine transitions from cranking to running.
When engine speed exceeds the configured Crank Exit RPM, the ECU exits the cranking state and begins applying the Post-Start Fuel Table. This additional fuel helps stabilise combustion during the first few seconds of engine operation while fuel films and air-fuel mixture conditions settle.
The Post-Start Fuel Table is typically configured as a function of coolant temperature, with colder engine temperatures requiring greater enrichment.
Post-start fuel compensation gradually decays to zero over a user-configurable period, allowing a smooth transition to normal fuel calculations.
🔧 Tuning Guidelines
Increase fuel values if the engine starts successfully but immediately stumbles, misfires, or stalls.
Decrease fuel values if the engine starts cleanly but runs excessively rich following start-up.
Ensure the post-start decay period is long enough to maintain stable combustion, particularly during cold starts.
ℹ️ Crank Exit RPM
The Crank Exit RPM setting defines the engine speed at which the ECU transitions from the Crank Fuel Table to the Post-Start Fuel Table.
Once engine speed exceeds the configured Crank Exit RPM, the engine is considered to be running and post-start fueling becomes active.
Note: Crank Exit RPM is a global ECU setting and may also be used by other ECU functions to determine whether the engine is in a cranking or running state.
Each starting fuel phase (Pre-Crank Fuel, Cranking Fuel, and Post-Start Fuel) includes a Table Control parameter which defines how the ECU sources fuel values during engine start.
This control determines whether a single fuel table is used or whether Z-axis blending is enabled between two calibration tables.
Available Options
Value
Mode
0
OFF
1
ON - Table 1
2
ON - Table 2
3
Not Available
4
Not Available
5
Not Available
6
ON - Z-Axis
Mode Descriptions
OFF (0)
Disables the selected starting fuel phase. No fuel contribution is applied from this table.
ON - Table 1 (1)
Uses Table 1 only for fuel calculation.
Typically represents the base calibration (e.g. Petrol / 0% Ethanol reference).
ON - Table 2 (2)
Uses Table 2 only for fuel calculation.
Typically represents the alternative calibration (e.g. E100 / 100% Ethanol reference).
ON - Z-Axis (6)
Enables Z-axis blending between Table 1 and Table 2.
The ECU interpolates between both tables based on the configured Z-axis input (typically Ethanol Content %), producing a blended fuel value.
0% Z-axis → 100% Table 1
100% Z-axis → 100% Table 2
Intermediate values → linear interpolation between both tables
Not Available (3–5)
Reserved for future functionality and should not be selected.
Z-Axis Blended Fueling (Dual Table Interpolation)
The ECU supports a Z-axis blending strategy that allows fuel values to be interpolated between two tables based on a third operating axis, typically Ethanol Content (E-content).
This feature is used to account for differences in fuel properties, vaporisation characteristics and cold start behaviour between fuels like Petrol (Gasoline) and Ethanol (E100).
Concept Overview
Two base tables are defined:
Table 1 (0% Ethanol Reference) Represents fuel requirements for standard Petrol operation.
Table 2 (100% Ethanol Reference) Represents fuel requirements for full Ethanol (E100) operation.
A third axis (Z-axis), typically Ethanol Content (0–100%), is used to interpolate between these two tables.
Operation
For any given operating condition, the ECU:
Looks up the required value in Table 1
Looks up the required value in Table 2
Reads the current Z-axis value (e.g. Ethanol Content %)
Calculates a blended output using linear interpolation between the two tables
Example
At 0% Ethanol, the output is taken entirely from Table 1 (Petrol)
At 100% Ethanol, the output is taken entirely from Table 2 (Ethanol)
At 50% Ethanol, the output is a 50/50 blend of both tables
At intermediate values, the ECU smoothly interpolates between the two
Application to Starting Fuel
This blending method can be applied to multiple starting fuel phases:
Pre-Crank Fuel
Cranking Fuel
Post-Start Enrichment
Each phase is independently blended using the same Z-axis strategy, allowing the ECU to automatically adjust fuel delivery based on ethanol content.
Benefits
Eliminates the need for separate fuel maps per fuel type
Ensures smooth transitions between fuel blends
Maintains consistent start behaviour across ethanol ratios
Improves cold-start robustness for flex-fuel operation
PreCrank Z-Axis Setup
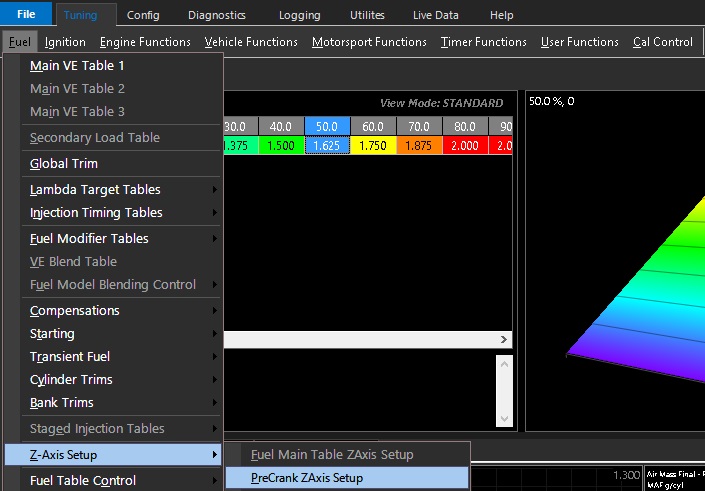
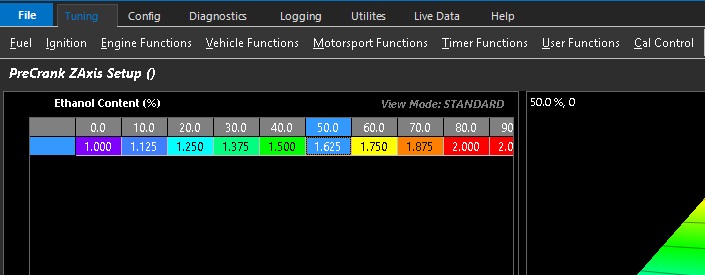
The Z-Axis activates a user definable X-Axis to swap or blend between PreCrank tables based on the selected runtime
PreCrank ZAxis spanned across ethanol content example shown above
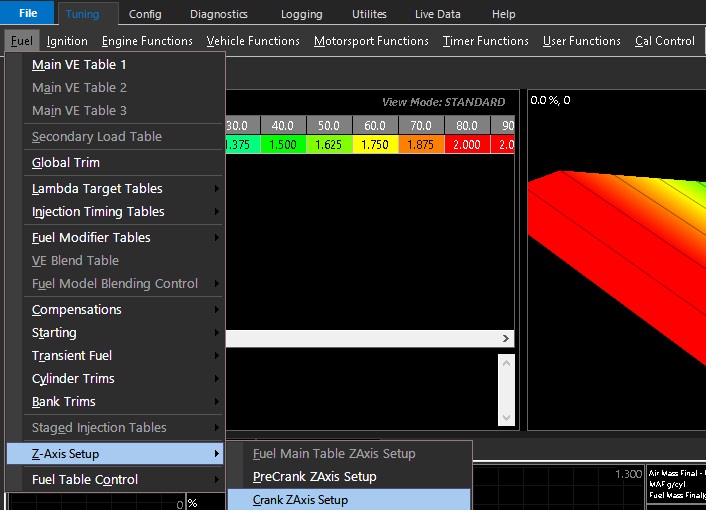
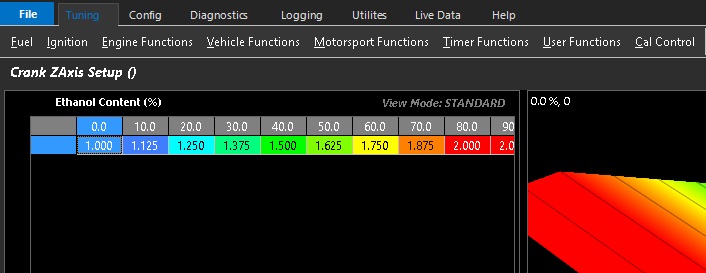
Crank Z-Axis Setup
The Z-Axis activates a user definable X-Axis to swap or blend between Crank tables based on the selected runtime
Crank ZAxis spanned across ethanol content example shown above
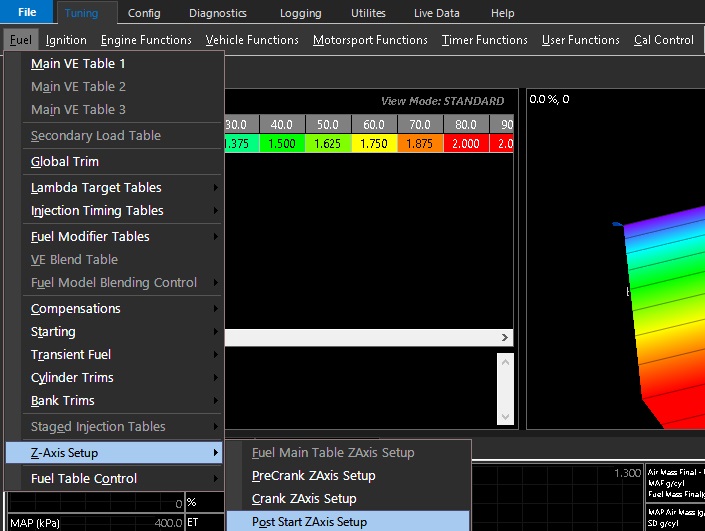
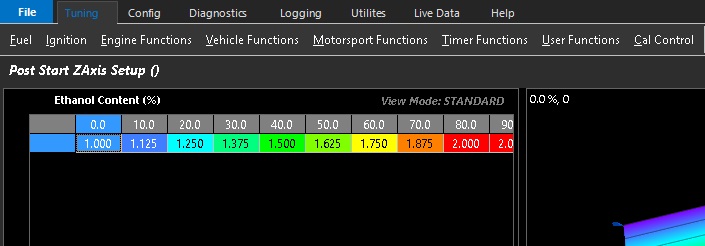
Post Start Z-Axis Setup
The Z-Axis activates a user definable X-Axis to swap or blend between Post Start tables based on the selected runtime
Post Start ZAxis spanned across ethanol content example shown above
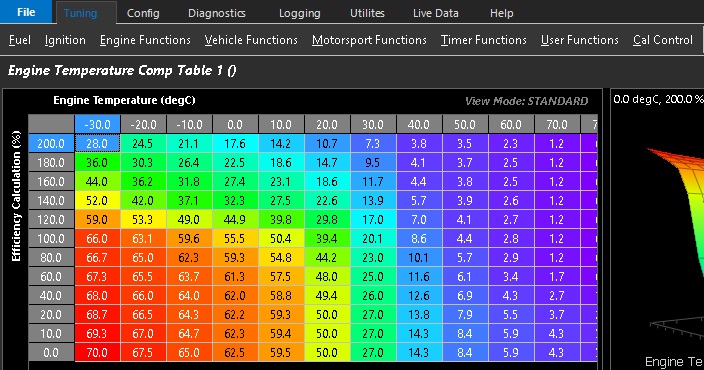
Engine Temperature Fuel Table
Overview
Additional fuel is typically required when the engine is cold to compensate for reduced fuel vaporisation and increased fuel condensation on intake port surfaces, intake valves and cylinder walls.
At low engine temperatures, a portion of the injected fuel does not immediately contribute to combustion. Instead, fuel can form liquid films on engine surfaces, reducing the amount of combustible fuel available within the cylinder. To maintain the desired air-fuel ratio and ensure stable engine operation, additional fuel compensation is required.
As engine temperature increases, fuel vaporisation improves and wall-wetting effects are reduced. The amount of compensation required therefore decreases progressively as the engine approaches normal operating temperature.
Engine load and airflow also influence the amount of compensation required. At higher engine loads, increased air mass flow and air velocity improve fuel atomisation and vaporisation, reducing the amount of fuel lost to wall wetting. As a result, less temperature-based enrichment is typically required at higher loads than at idle or light load conditions for the same engine temperature.
The Engine Temperature Fueling table is used to define this compensation as a function of engine coolant temperature and load (engine air mass flow). Larger corrections are required at low temperatures, gradually reducing to zero additional compensation once normal operating temperature has been reached.
Correct calibration of Engine Temperature Fueling is important for cold start performance, idle stability, throttle response and overall drivability during engine warm-up.
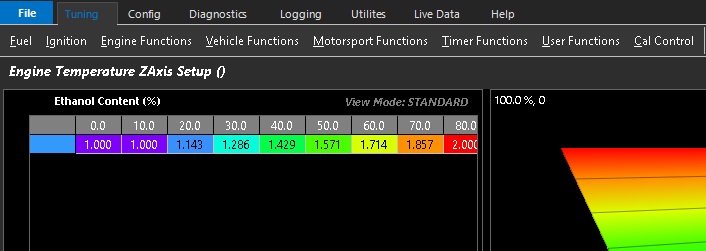
Engine Temperature Warm-up Z-axis Setup
The Z-Axis activates a user definable X-Axis to swap or blend between Engine Temperature Tables 1 and 2 based on the selected runtime. Refer to the supplied sample showing Engine Temperature ZAxis spanned across ethanol content.
Fuel Tuning Overview
Overview
The fueling calculations used by Emtron are based on an Air Mass per cycle which is then converted to a Fuel Mass based on the requested lambda target. This is true whether the system is using directly measuring airflow from the air mass meter, or calculated air mass from speed density or throttle mass flow (TMF)
Example.
With an engine operating at 85% VE and has a known Charge Temperature and Manifold Pressure, the ECUs calculates an Air Mass per Induction of 0.789 grams. To achieve at Lambda target of 0.85 (12.50 AFR petrol) the corresponding fuel mass needs to be 0.06312 grams. With a known Injector Size in cc/min and Fuel Density (g/ml) the injector mass flow can be determined. Lets use 10.73 grams/sec.
ℹ️ Note Other factors also affect the injector mass flow. When enabled the ECU monitors the differential pressure across the injector and corrects if it moves away from the nominal static pressure. It does this using “Bernoulli’s equation” which is a square root law.
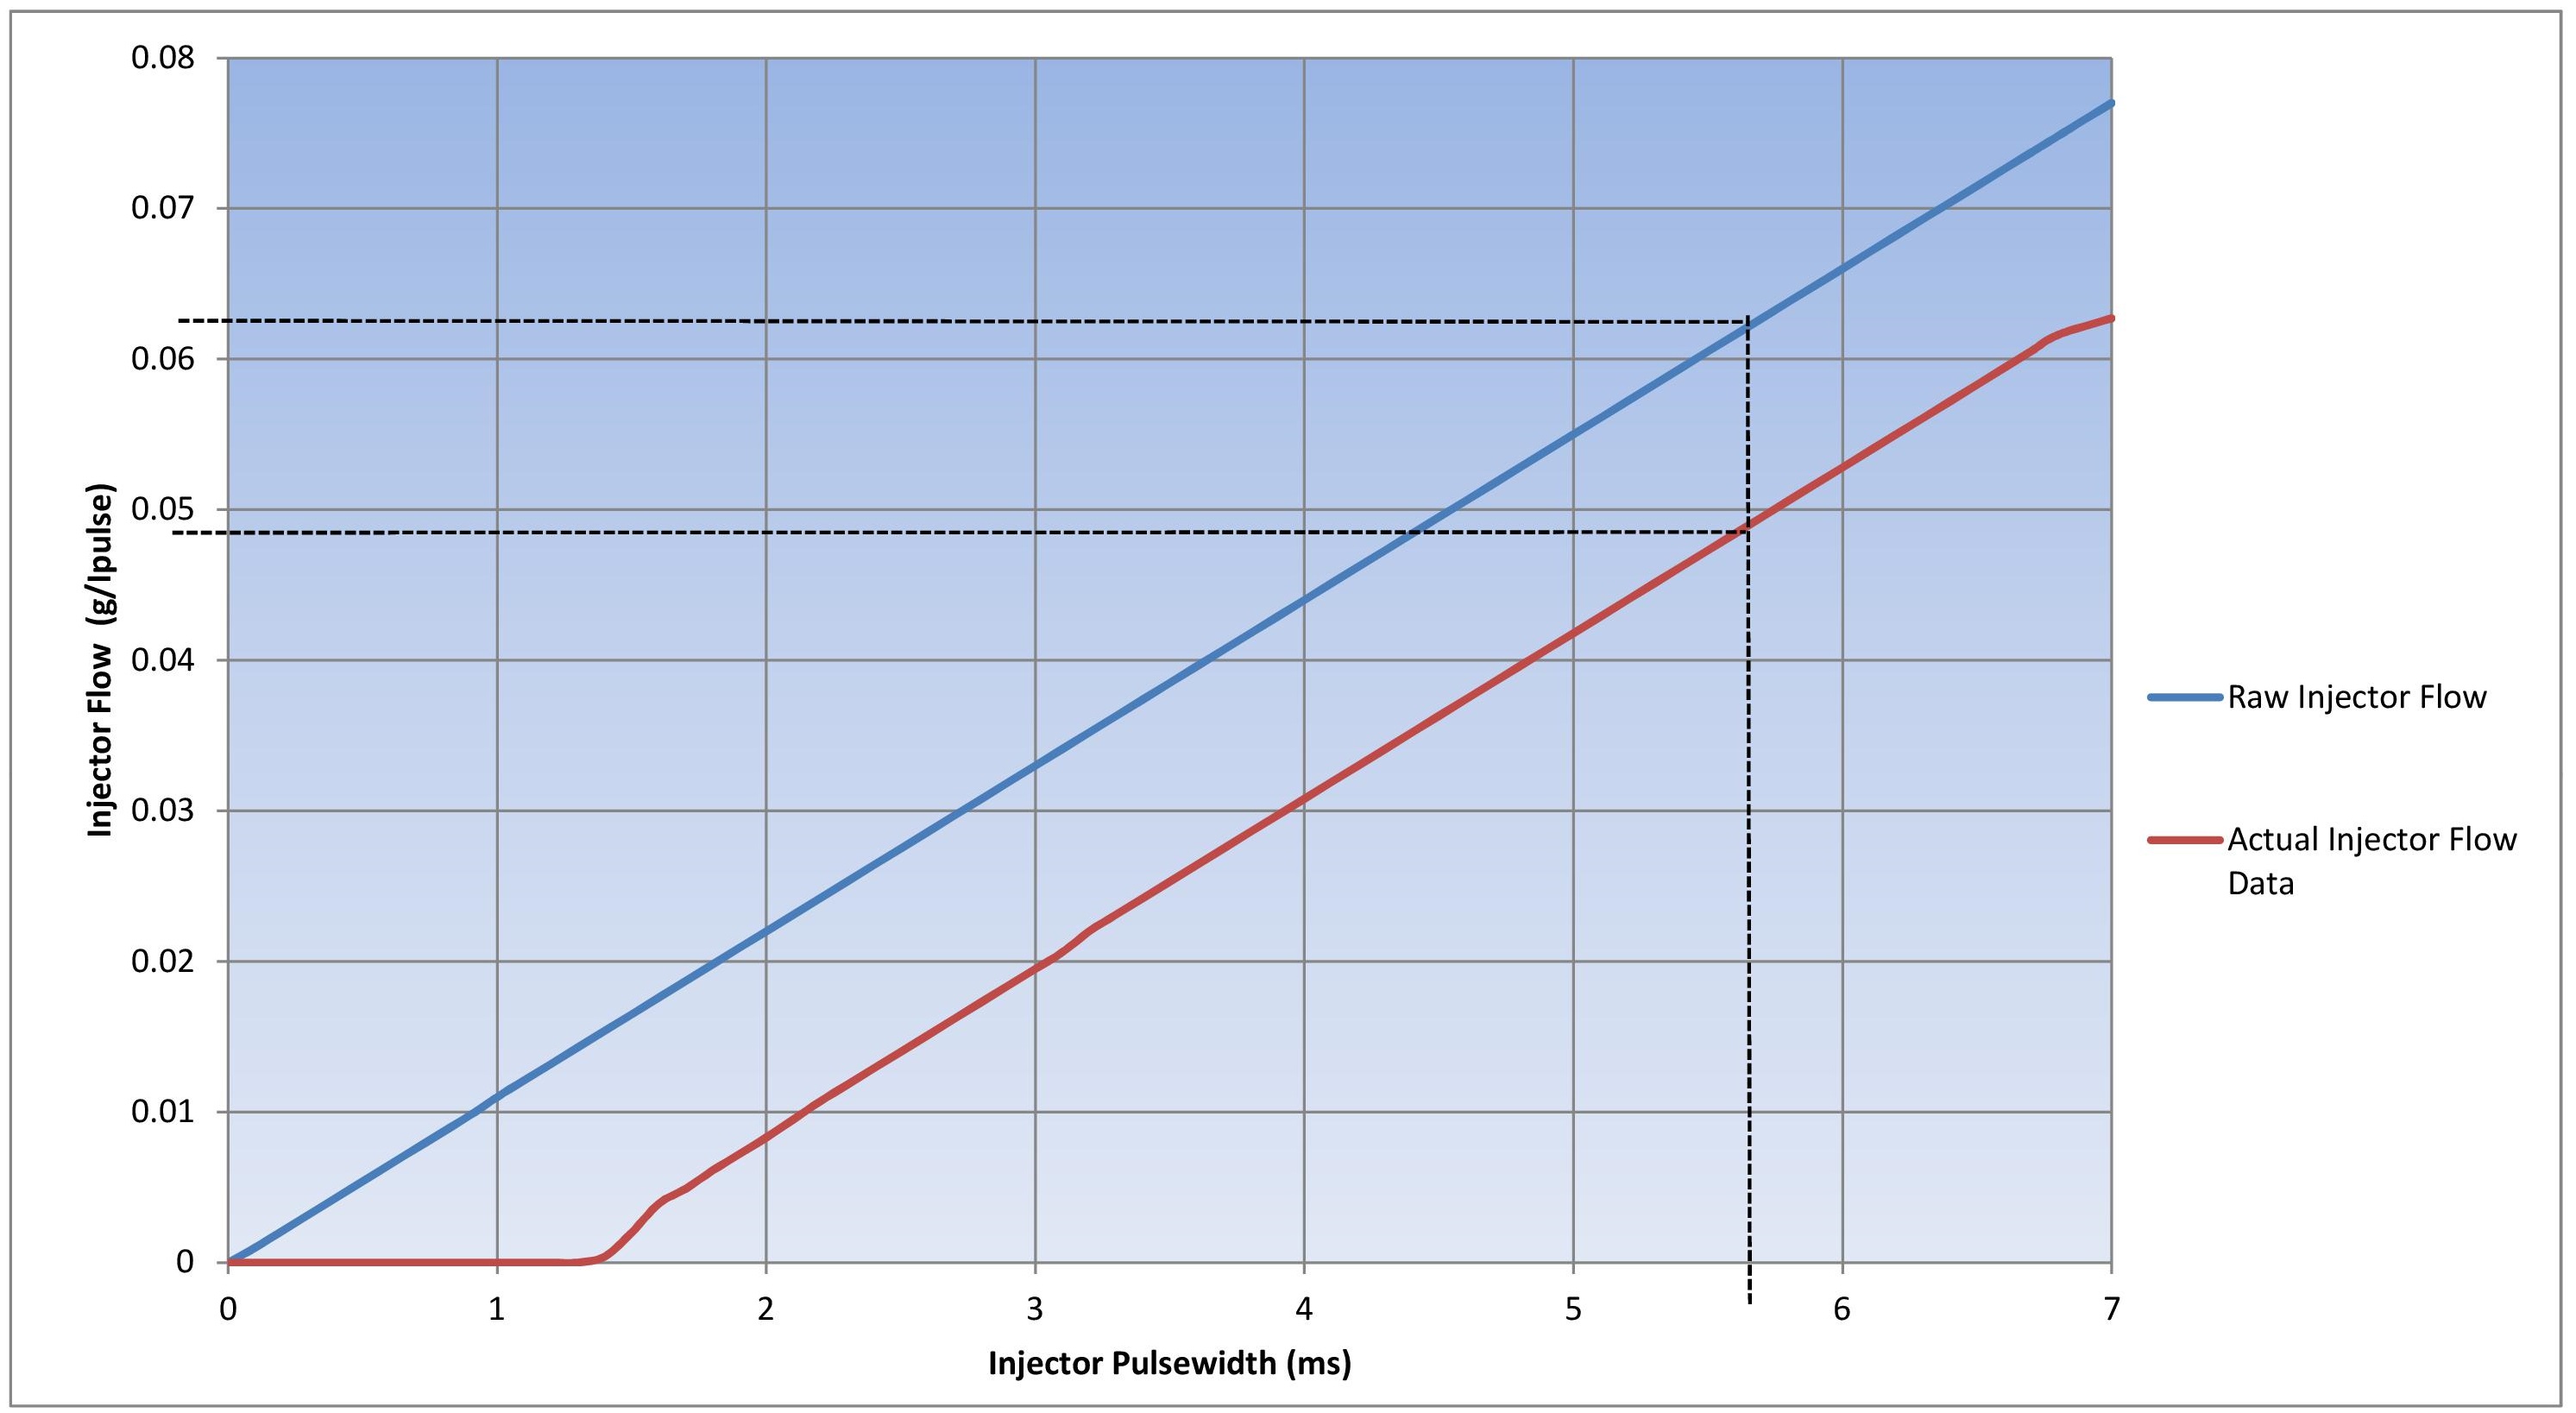
Knowing that our fuel injector has a static flow rate of 10.73 grams per second, we divide that into our fuel mass and arrive at a injector pulsewidth value of 5.704 ms. However, the injector cannot just be opened for this time to achieve the calculated Fuel Mass. The Dynamic Characteristics of the fuel injector must be used. This includes injector deadtime and low pulse width non-linearities.
The Graph below of Theoretical vs Actual flow explains this better. The Blue line is the Raw/Theoretical Flow and the Red line is the actual Injector Flow .. note the large error. At 5.7ms the actual fuel mass produced by the injector is 0.0587g instead of the calculated 0.06312 g. This is only 93% of the fuel requested.
The flow error is caused by an offset that exists between the actual injector flow (Red line) and the theoretical flow (Blue line). This offset exists on all injectors and must be included for the fuel calculation to be accurate. As the offset is constant across the “majority” of the injector operating range, we can correct for it by adding it to our final injector pulsewidth. This offset error/flow error is known as Injector Deadtime. The ECUs uses a 3D deadtime table spanned on Battery Voltage and Differential Fuel Pressure. See section Injector Deadtime Table for more information.
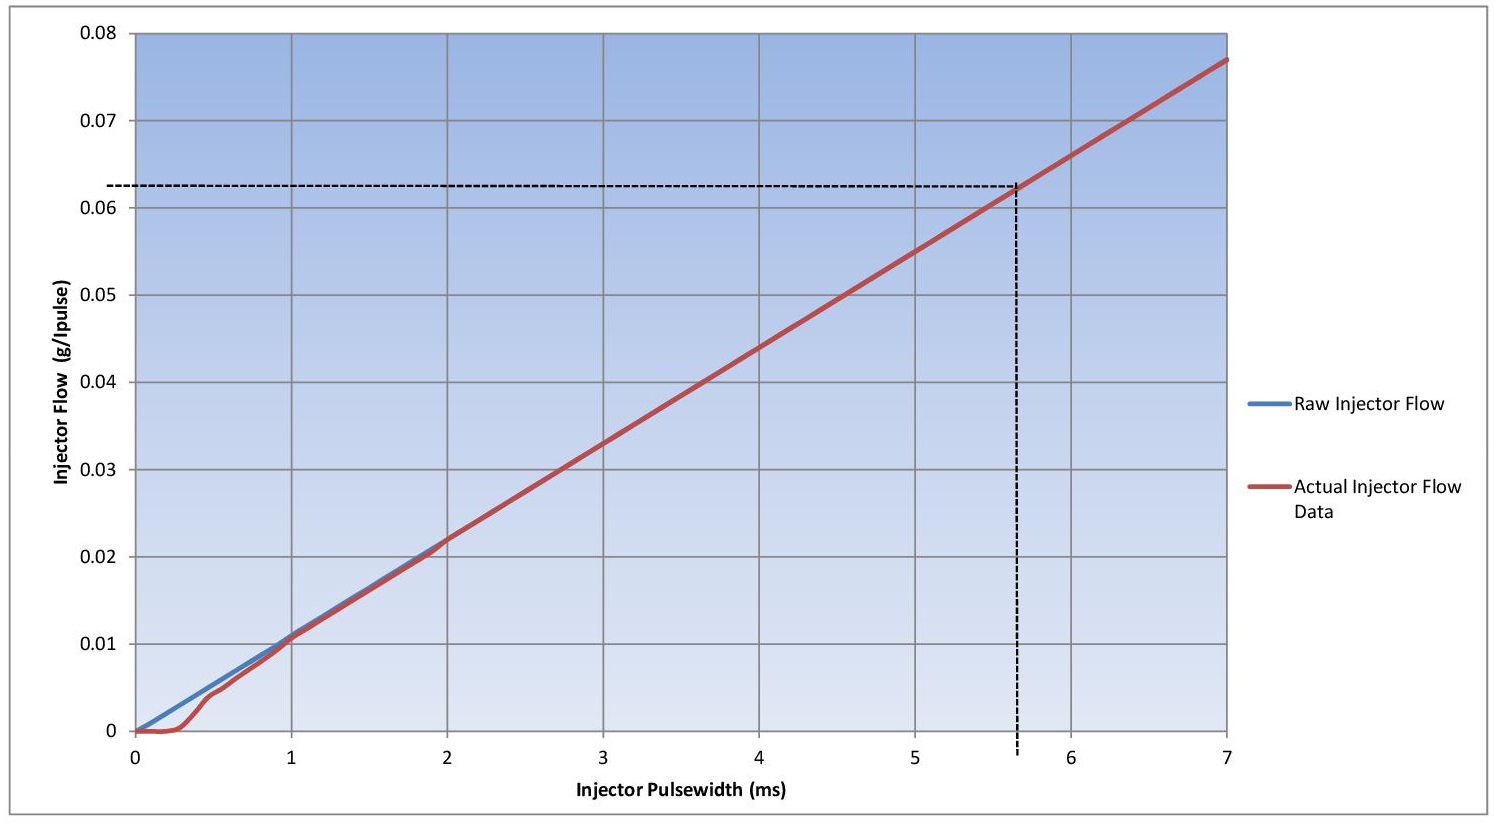
Once the offset is corrected the Theoretical vs Actual flow graph looks like:
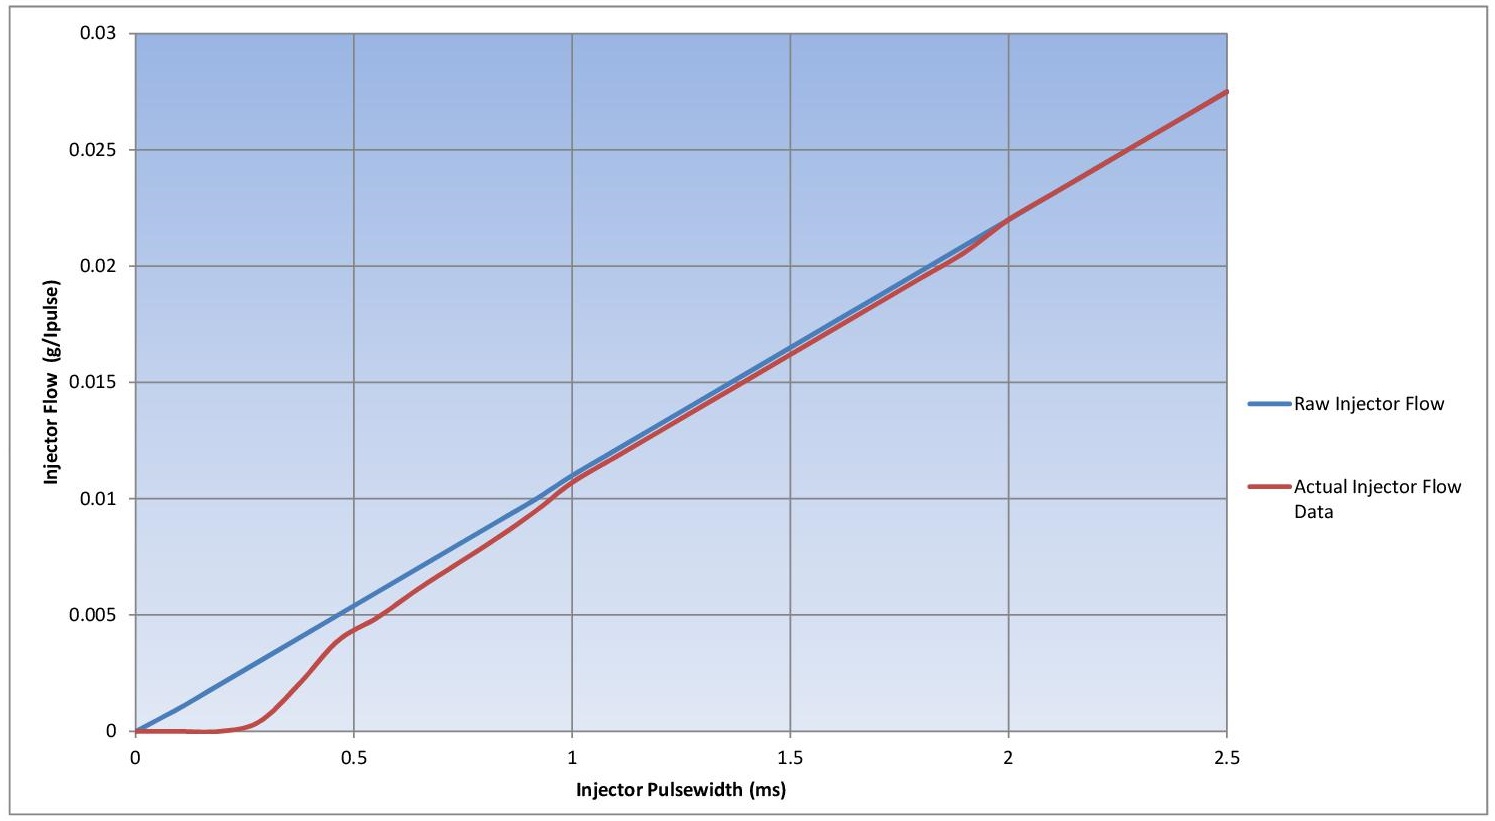
The correction across “most” of the operating range is complete and we can expect the ECU calculated pulsewidth to deliver the requested mass flow. However the range at low pulsewidth still has errors i.e there is a difference between the theoretical and actual pulse with. This is known as the “non linear operating range” of the injector and the graph below has this area zoomed in.
Below 2 ms we have a situation similar to our initial conditions where there was an offset between the actual flow, and theoretical flow of the injector. Unlike the offset within the linear operating range of the injector, this is not constant, and cannot be corrected for with a single value.
The solution is the low pulse adder table which uses offset values that vary with pulsewidth, correcting the lower non linear operating range of the injector. More information can be found Injector Low Pulsewidth Linearisation
With the addition of these values the ECU can achieve nearly perfect fueling down to practically zero flow, and the ECU can do its job of calculating and commanding the correct air fuel ratio under all operating conditions.
Charge Temperature Estimation
Charge Temperature Estimate Table - Overview
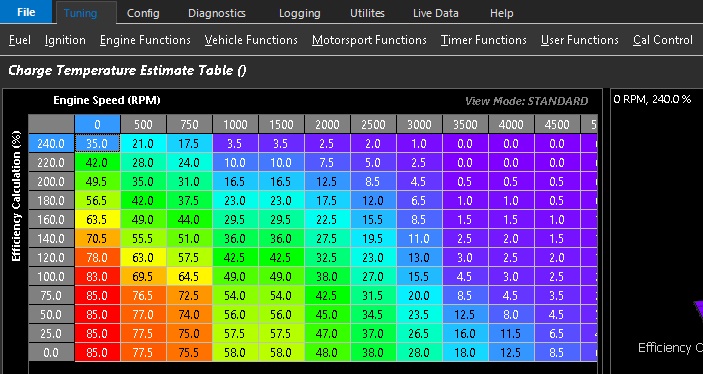
The Charge Temperature Estimate table is used to calculate the estimated temperature of the air entering the combustion chamber. This estimated charge temperature is derived by blending the Inlet Air Temperature (IAT) sensor reading with the Engine Coolant Temperature (ECT).
Under many operating conditions, the measured intake air temperature does not accurately represent the temperature of the air charge entering the cylinder. Heat transfer from the intake manifold, cylinder head and engine components can significantly warm the intake charge, particularly during idle, low airflow and hot restart conditions.
The Charge Temperature Estimate table allows the ECU to compensate for these effects by blending the Intake Air Temperature with the Engine Coolant Temperature as a function of engine operating conditions.
Table Values
Table values are expressed as a percentage and determine the contribution of the Engine Coolant Temperature to the calculated charge temperature.
Value
Estimated Charge Temperature
0%
Charge Temperature = Intake Air Temperature
50%
Charge Temperature = Midway between Intake Air Temperature and Engine Coolant Temperature
100%
Charge Temperature = Engine Coolant Temperature
ℹ️ Important
The Charge Temperature Estimate function uses only the configured Inlet Air Temperature (IAT) sensor and Engine Coolant Temperature (ECT) sensor to estimate the Charge Temperature.
No other air temperature source is considered during this calculation. If multiple temperature sensors are configured within the ECU, only the Inlet Air Temperature (IAT) sensor is used for the air temperature component of the blend.
🔧 Tuning Guidelines
At low engine speed and light engine load, airflow through the intake system is relatively low. This allows heat from the engine to warm the intake manifold and incoming air, causing the actual charge temperature to be significantly higher than the measured Intake Air Temperature. Higher blend values are therefore typically required.
As engine speed and engine load increase, air mass flow through the intake system also increases. The higher airflow reduces heat transfer from the engine, allowing the Intake Air Temperature sensor to more accurately represent the temperature of the air entering the cylinder. Consequently, lower blend values are generally required.
For turbocharged and supercharged engines operating under boost, the Intake Air Temperature sensor typically provides an accurate measurement of the compressed intake charge. Little or no Engine Coolant Temperature blending is therefore normally required at higher engine loads.
ℹ️ Notes
The table axes are Engine Speed (RPM) and Efficiency Calculation/ Manifold Pressure (kPa).
Lower table values place greater reliance on the Intake Air Temperature sensor.
Higher table values increase the influence of Engine Coolant Temperature to compensate for engine heat soak.
Correct calibration improves air density estimation, resulting in more accurate fuel delivery and ignition calculations during idle, heat soak, hot restart and transient operating conditions.
Charge Temperature Offset Table
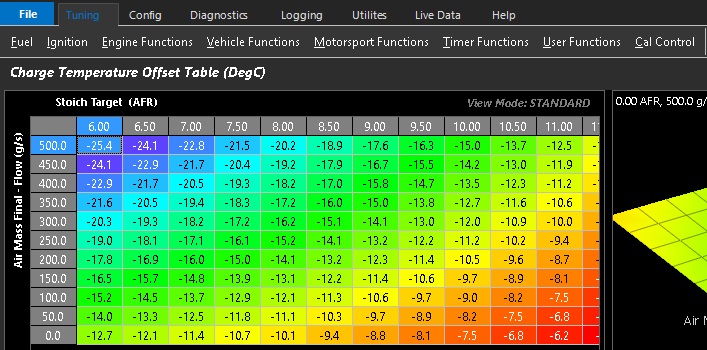
The Charge Temperature Offset table applies an absolute temperature correction to the calculated Charge Temperature Estimate. This table is used to compensate for the cooling effect of fuel evaporation, which is not directly accounted for by the Charge Temperature Estimate calculation.
Table values are expressed in degrees Celsius (°C) and are added to or subtracted from the calculated Charge Temperature Estimate. A negative value reduces the calculated Charge Temperature, while a positive value increases it.
Typical Table Axes
X-Axis: Stoichiometric Target (AFR)
Y-Axis: Inlet Air Temperature (IAT)
Operation
Different fuels absorb different amounts of heat as they evaporate. Fuels with a high latent heat of vaporisation, such as Ethanol and Methanol, can significantly cool the intake charge during the injection process. By applying a negative Charge Temperature Offset, the ECU can compensate for this evaporative cooling effect, producing a more accurate estimate of the air charge temperature for fuel and ignition calculations.
For conventional gasoline fuels, little or no offset is typically required.
🔧 Tuning Guidelines
Gasoline applications typically require minimal or no correction.
Ethanol blends generally require a moderate negative offset.
Methanol applications often require a larger negative offset due to its high evaporative cooling effect.
Flex Fuel applications can use this table to progressively increase the cooling correction as ethanol content increases. Refer to the supplied sample calibration for an example implementation.
ℹ️ Important
The Charge Temperature Offset is applied after the Charge Temperature Estimate has been calculated. It does not alter the Charge Temperature Estimate blending between the Inlet Air Temperature (IAT) and Engine Coolant Temperature (ECT); it simply adds or subtracts a fixed temperature offset from the final calculated Charge Temperature Estimate.
Charge Temperature Fuel Table
The Charge Temperature Fuel table applies a percentage fuel correction to the Base Pulse Width
The ECU uses the Charge Temperature Estimate during the air mass calculation to determine the amount of air entering the engine. The calculated air mass is then used to determine the required fuel delivery.
In some engine combinations, the calculated charge temperature may not perfectly model the actual cylinder charge temperature under all operating conditions. This can result in small fueling errors. The Charge Temperature Fuel table provides a means of applying a fine fuel correction to compensate for these residual errors.
Table Values
Table values are expressed as a percentage (%).
Positive values increase the Base Pulse Width (richer).
Negative values decrease the Base Pulse Width (leaner).
0% applies no fuel correction.
🔧Tuning Notes
In most applications, this table can be left at 0% across the entire operating range.
The Charge Temperature Estimate table should be calibrated first to provide the most accurate estimate of the cylinder charge temperature. Then adjust the Charge Temperate Fuel Table if required.
Large corrections typically indicate that the Charge Temperature Estimate table should be reviewed before using this table for compensation.
ℹ️ Important
This table does not modify the calculated Charge Temperature. It applies a percentage correction to the Base Pulse Width after the Charge Temperature Estimate has been used during the ECU’s air mass calculation.
Charge Temperature Fuel Table Control
Enables or disables the Charge Temperature Fuel Table.
When enabled, the Charge Temperature Estimate Fuel Table applies a percentage fuel correction to the Base Pulse Width.
When disabled, no fuel correction is applied and the Charge Temperature Fuel Table is ignored.
Options
Value
Mode
0
Disabled
1
Enabled
⚠️ Notes
In most applications, the Charge Temperature Fuel Table can remain disabled, as little or no additional fuel correction is typically required.
Acceleration Fuel Compensation
During rapid changes in throttle position and engine load, fuel delivery does not immediately track the change in airflow. This is due to a portion of the injected fuel temporarily adhering to the intake port walls and intake valves as a liquid film before it evaporates and is drawn into the combustion chamber.
When airflow increases rapidly, additional fuel is temporarily required to establish the larger fuel film while maintaining the correct air-fuel ratio. Without this compensation, the engine will momentarily operate lean, resulting in hesitation, poor throttle response or engine stumble.
Conversely, when airflow decreases rapidly, the existing fuel film continues to evaporate even though less fuel is being injected. This can temporarily enrich the mixture, requiring fuel to be removed to maintain the commanded air-fuel ratio.
Transient Fuel Compensation automatically adds or subtracts fuel during rapid changes in engine airflow to maintain the commanded air-fuel ratio, improve throttle response and ensure smooth engine drivability. During operation, the ECU continuously calculates the following transient fuel runtimes. These values are applied to the Final Injection Pulse Width to compensate for transient fuel film dynamics.
Runtime
Description
Accel Fuel
Additional injector pulse width calculated during acceleration and added to the Final Injection Pulse Width.
Accel Clamp
Maximum transient fuel that may be added under the current operating conditions.
Decel Fuel
Injector pulse width removed during deceleration and subtracted from the Final Injection Pulse Width.
Decel Clamp
Maximum transient fuel that may be removed under the current operating conditions.
Fuel Accel/Decel Scaler
Engine Temperature compensation multiplier applied to the calculated Accel Fuel and Decel Fuel corrections.
Transient Setup
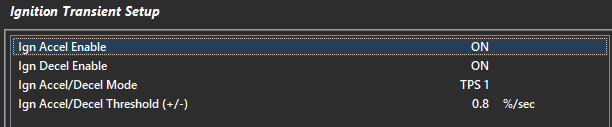
Accel Enable Enables or disables Transient Acceleration Fuel Compensation.
Decel Enable Enables or disables Transient Deceleration Fuel Compensation.
Accel/Decel Mode Selects the runtime input used to initiate the transient fuel compensation function.
Value
Input
0
TPS 1 – Throttle Position Sensor 1 or Drive-By-Wire Servo Position Sensor 1(when enabled)
1
MAP – Manifold Absolute Pressure
2
PP 1 – Pedal Position Sensor 1
Accel/Decel Threshold (+/-) Defines the minimum rate of change required to activate the transient fuel compensation function. The threshold is expressed as the rate of change per second.
Lower values increase sensitivity, causing the function to activate more readily.
Higher values reduce sensitivity and help prevent unnecessary transient fuel corrections.
A typical starting value is 1.0 units/second of the selected input.
A typical value is 1.0 %/sec.
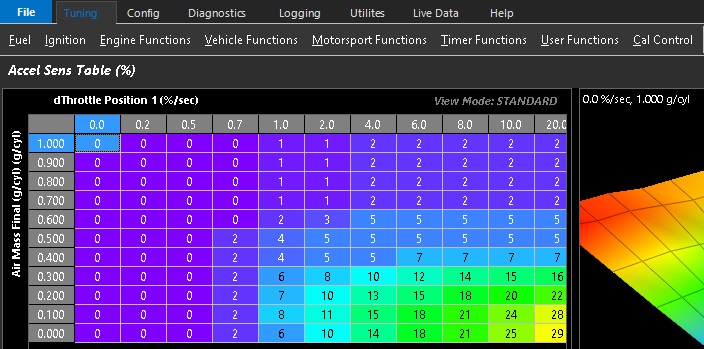
Accel Sensitivity Table
The Accel Sensitivity Table is the multiplication factor, expressed as a percentage, that determines the amount of transient fuel added based on the rate of change of the selected Accel/Decel Mode.
Example:
Operating Conditions
TPS Rate of Change (dTPS1) = 20 %/sec
Accel Sensitivity = 10%
Base Pulse Width = 5.0 ms
Calculation
Accel Fuel = dTPS1 × Accel Sensitivity
           = 20 × 0.10
           = 2.0 ms

Final Injection Pulse Width
= Base Pulse Width + Accel Fuel
= 5.0 ms + 2.0 ms
= 7.0 ms
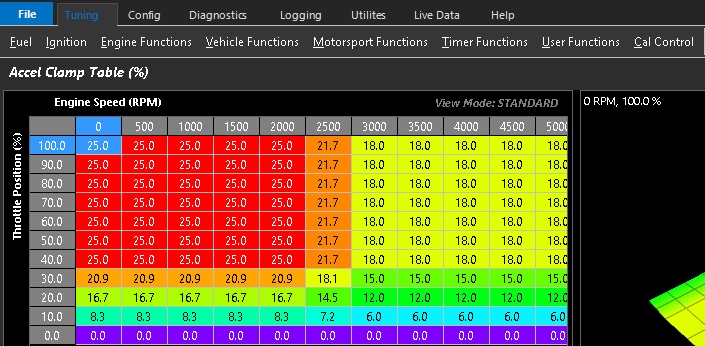
Accel Clamp Table
The Accel Clamp Table limits the maximum amount of additional fuel that can be applied during transient acceleration enrichment events. It defines the maximum allowable increase in injector pulse width (PW), expressed as a percentage of the calculated base fuel pulse width. This prevents excessive transient enrichment during rapid throttle changes, helping to maintain stable air-fuel ratio control and avoiding over-fuelling.
Example:
Calculation
Accel Clamp = 50%
Base Fuel Pulse Width = 4.0 ms

Maximum additional fuel allowed:
= 50% of 4.0 ms
= 0.5 × 4.0 ms
= 2.0 ms

Therefore:
- Base PW = 4.0 ms
- Max Accel Enrichment = 2.0 ms
- Total Maximum PW = 6.0 ms
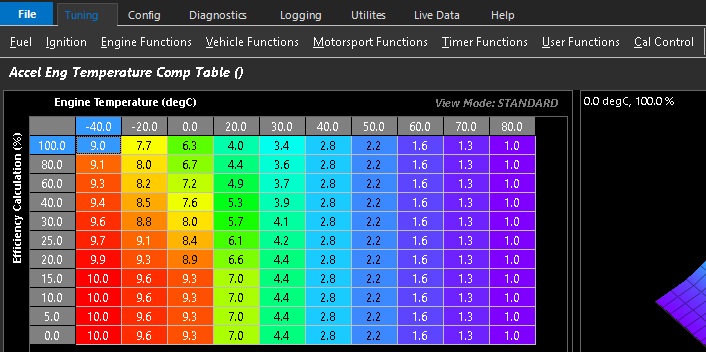
Accel Engine Temperature Comp Table
The Accel Engine Temperature Compensation Table introduces a multiplier of the calculated accel fuel value against engine temperature
Example:
Calculation
Accel fuel = 10ms
Engine Temperature Comp = 1.5

Total Accel fuel = 10 * 1.5 = 15.0ms
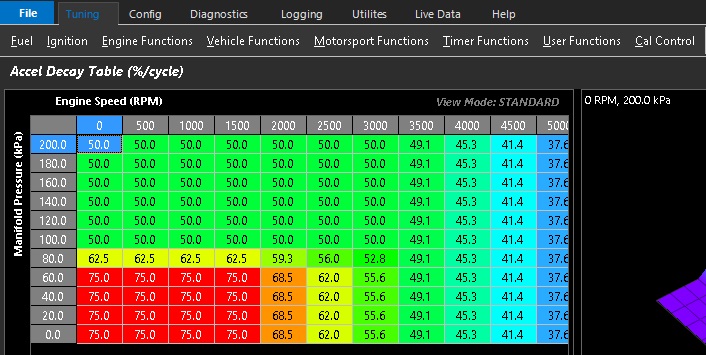
Accel Decay Table
The Accel Decay Table defines the rate at which transient acceleration fuel is removed from the fueling calculation. This value determines how quickly the additional enrichment decays over successive engine cycles, expressed as a percentage reduction per cycle.
Example:
Calculation
Accel decay = 10%
Accel fuel will decay back 10% every cycle
Deceleration Fuel Compensation
During rapid changes in throttle position and engine load, fuel delivery does not immediately track the change in airflow. This is due to a portion of the injected fuel temporarily adhering to the intake port walls and intake valves as a liquid film before it evaporates and is drawn into the combustion chamber.
When airflow increases rapidly, additional fuel is temporarily required to establish the larger fuel film while maintaining the correct air-fuel ratio. Without this compensation, the engine will momentarily operate lean, resulting in hesitation, poor throttle response or engine stumble.
Conversely, when airflow decreases rapidly, the existing fuel film continues to evaporate even though less fuel is being injected. This can temporarily enrich the mixture, requiring fuel to be removed to maintain the commanded air-fuel ratio.
Transient Fuel Compensation automatically adds or subtracts fuel during rapid changes in engine airflow to maintain the commanded air-fuel ratio, improve throttle response and ensure smooth engine drivability. During operation, the ECU continuously calculates the following transient fuel runtimes. These values are applied to the Final Injection Pulse Width to compensate for transient fuel film dynamics.
Runtime
Description
Accel Fuel
Additional injector pulse width calculated during acceleration and added to the Final Injection Pulse Width.
Accel Clamp
Maximum transient fuel that may be added under the current operating conditions.
Decel Fuel
Injector pulse width removed during deceleration and subtracted from the Final Injection Pulse Width.
Decel Clamp
Maximum transient fuel that may be removed under the current operating conditions.
Fuel Accel/Decel Scaler
Engine Temperature compensation multiplier applied to the calculated Accel Fuel and Decel Fuel corrections.
Transient Setup
Accel Enable Enables or disables Transient Acceleration Fuel Compensation.
Decel Enable Enables or disables Transient Deceleration Fuel Compensation.
Accel/Decel Mode Selects the runtime input used to initiate the transient fuel compensation function.
Value
Input
0
TPS 1 – Throttle Position Sensor 1 or Drive-By-Wire Servo Position Sensor 1(when enabled)
1
MAP – Manifold Absolute Pressure
2
PP 1 – Pedal Position Sensor 1
Accel/Decel Threshold (+/-) Defines the minimum rate of change required to activate the transient fuel compensation function. The threshold is expressed as the rate of change per second.
Lower values increase sensitivity, causing the function to activate more readily.
Higher values reduce sensitivity and help prevent unnecessary transient fuel corrections.
A typical starting value is 1.0 units/second of the selected input.
A typical value is 1.0 %/sec.
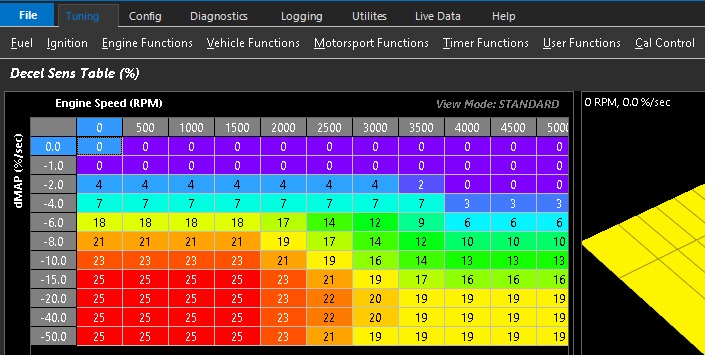
Decel Sensitivity Table
The Decel Sensitivity Table is the multiplication factor, expressed as a percentage, that determines the amount of transient fuel removed based on the rate of change of the selected Accel/Decel Mode.
Example:
Operating Conditions
TPS Rate of Change (dTPS1) = 10 %/sec
Decel Sensitivity = 10%
Base Pulse Width = 5.0 ms
Calculation
Decel Fuel = dTPS1 × Accel Sensitivity
           = 10 × 0.10
           = 1.0 ms

Final Injection Pulse Width
= Base Pulse Width - Accel Fuel
= 5.0 ms - 1.0 ms
= 4.0 ms
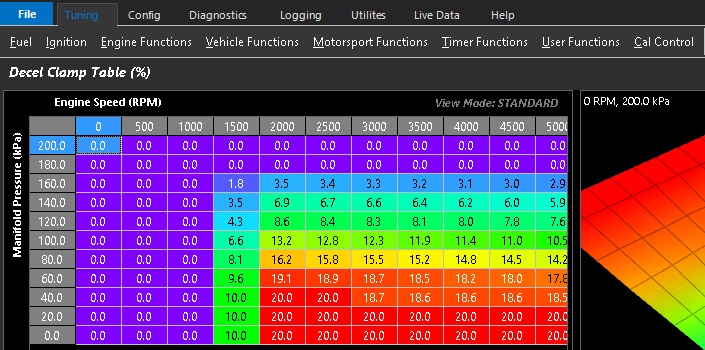
Decel Clamp Table
The decel Clamp Table limits the maximum amount of fuel that can be remvoved during transient deceleration event. It defines the maximum allowable decrease in injector pulse width (PW), expressed as a percentage of the calculated base fuel pulse width. This prevents excessive transient enleanment during rapid throttle changes, helping to maintain stable air-fuel ratio control and avoiding under-fuelling.
Example:
Calculation
Accel Clamp = 50%
Base Fuel Pulse Width = 4.0 ms

Maximum additional fuel allowed:
= 50% of 4.0 ms
= 0.5 × 4.0 ms
= 2.0 ms

Therefore:
- Base PW = 4.0 ms
- Max Decel Enleanment = 2.0 ms
- Total Maximum PW = 2.0 ms
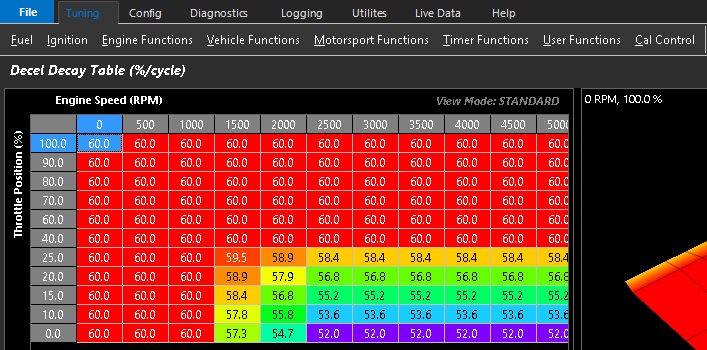
Decel Decay Table
The Decel Decay Table controls the rate of decay or how quickly the removed decel fuel is returned as a percentage of an engine cycle
Example:
Decel fuel start value = 10ms
Decel decay = 10%
Decel fuel will decay back to zero 10% per engine cycle
Cylinder Fuel Trims
Cylinder trims are used to apply fine fuel corrections on a per-cylinder basis in order to improve combustion balance across all cylinders. Even in well-calibrated engines, small differences in airflow distribution, injector flow characteristics, and combustion efficiency can result in uneven cylinder operation.
Typical reasons for using cylinder trims include:
Balancing EGT distribution across all cylinders to reduce thermal stress
Correcting minor airflow or volumetric efficiency differences between cylinders
Compensating for injector flow variation or ageing effects
Improving overall engine smoothness and combustion consistency
Reducing the risk of individual cylinders running lean or rich under load
Cylinder trims can be enabled per cylinder and provide a ± fuel mass percentage correction via a 3D table.
Table Control
Cylinder Trims are enabled from Fuel -> Cylinder Fuel Trims -> Cylinder Trim Table Control
OFF – The Trim Table is Off ON - The Trim Table is On
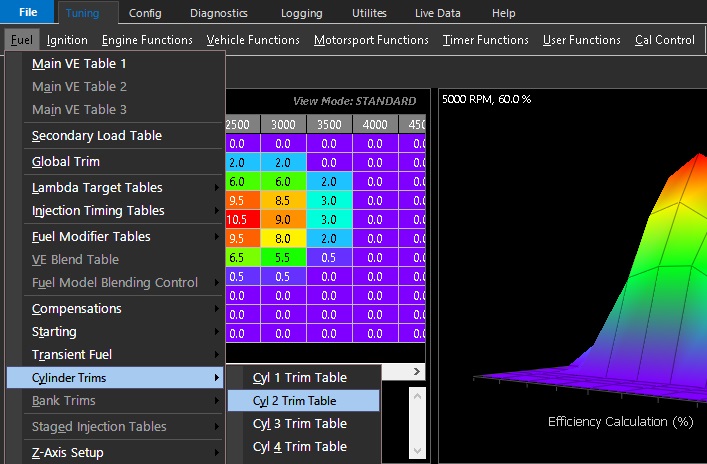
Each trim table will appear individually under Fuel -> Cylinder Fuel Trims
Fuel Bank Trims
Overview
Bank Trims allow fuel mass percentage corrections to be applied independently to each cylinder bank.
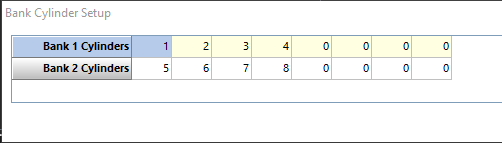
Each cylinder can be assigned to either Bank 1 or Bank 2, enabling separate fuel control for grouped cylinders.
Bank 1 and Bank 2 each include a dedicated 3D correction table, used to apply fuel compensation based on engine operating conditions such as engine speed and load.
These trims are typically used to correct for bank-to-bank fuel distribution differences, sensor tolerances, or airflow imbalance between intake paths.
ℹ️ Important
Cylinder-to-bank assignment is required for this function. Each cylinder must be mapped to either Bank 1 or Bank 2 to ensure accurate fuel trim application across all cylinders.
See Config -> Engine Setup -> Bank Cylinder Setup
Table Control
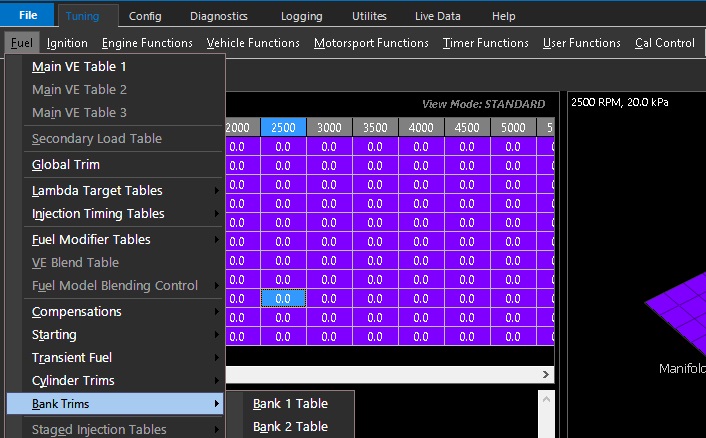
Bank Trims are enabled from Fuel -> Bank Fuel Trims -> Bank Trim Table Control
OFF - The Trim Table is Off ON - The Trim Table is On
Fuel Compensations
Compensations
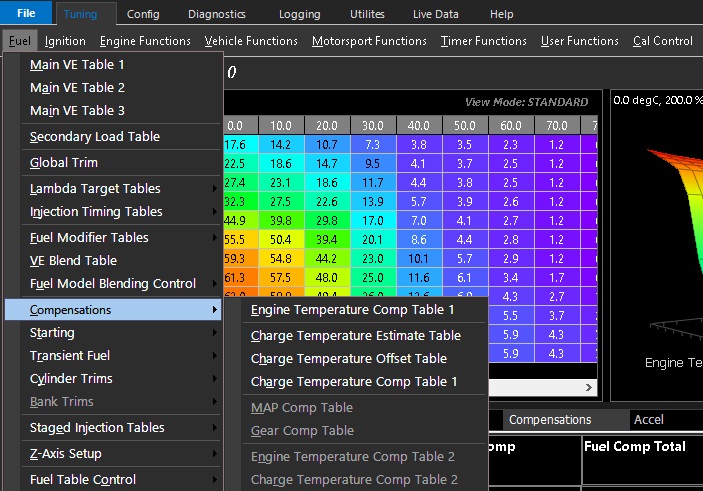
All Fuel Compensations (other than Charge Temperature Estimate and Charge Temperature Offset) are percentage compensations added/subtracted onto Final Fuel Mass calculations :
Fuel Mass Final Uncorrected = 0.0367g
Injector Mass Flow = 309 g/sec
User Comp 1 = +19.5%
Fuel Mass Final Corrected = 0.0367 x 1.195 = 0.0438g
Effective Pulsewidth Effective = Fuel Mass Final Corrected x (1/Injector Mass Flow )x 60
Effective Pulsewidth Effective = 0.0438 x 1/309 x 60 = 8.515ms
Compensation Tables
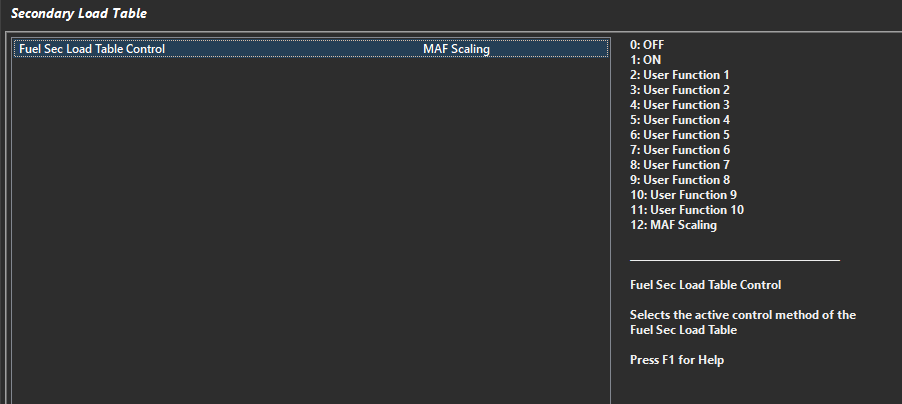
Fuel Sec Load (Secondary Load Compensation) can be turned on/off.
The compensation can be turned on/off or be selected to be on via a User Function (only active when User Function is active).
OFF – The Compensation Table is Off
ON – The Compensation Table is always On
User Function 1-10 – The Compensation Table is on only when the selected User Function is Active
MAF Scaling – The Compensation is a “Scaler” (in %) of the MAF signal * Used for Sec Load Table
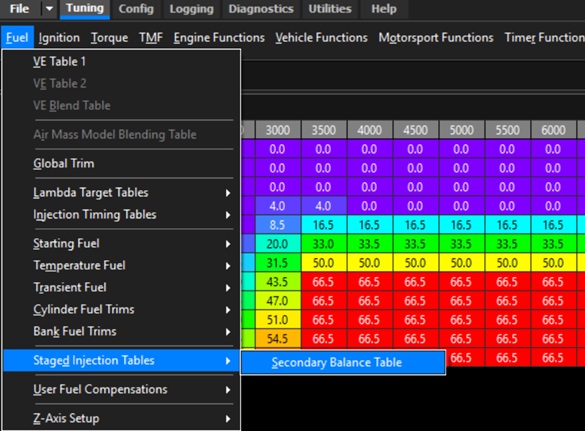
Secondary Injection Balance Table
Overview
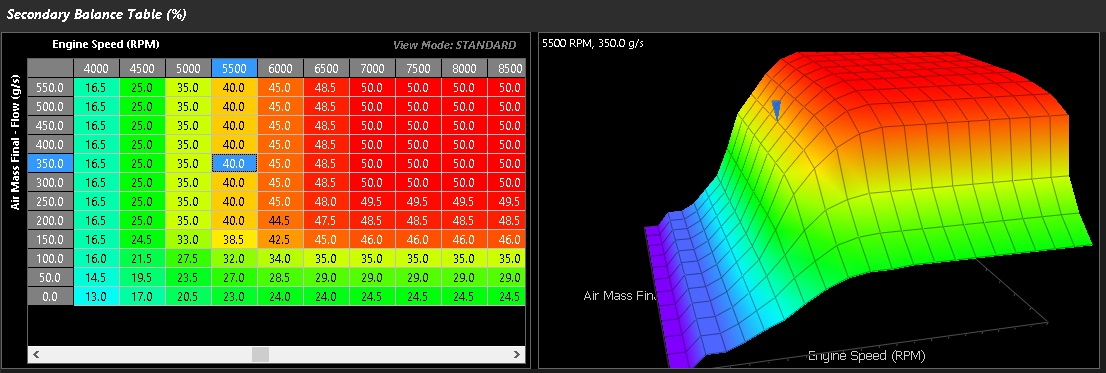
The Secondary Balance Table defines how the total fuel required for each injection event is divided between the Primary and Secondary injectors.
Table values are expressed as a percentage (%) and represent the proportion of the total fuel volume delivered by the Secondary injectors. The remaining fuel is automatically delivered by the Primary injectors.
Table Values
Value
Fuel Distribution
0%
0% Secondary injectors, 100% Primary injectors
50%
Equal fuel volume delivered by the Primary and Secondary injectors
100%
100% Secondary injectors, 0% Primary injectors
Intermediate values proportionally divide the required fuel between the Primary and Secondary injectors.
ℹ️ Note
The Secondary Balance Table controls the fuel volume distribution between the Primary and Secondary injectors. The ECU automatically calculates the individual injector pulse widths based on the injector flow rates and the configured Secondary Balance value to achieve the required total fuel delivery.
When the Primary and Secondary injector flow rates are correctly configured and calibrated, changing the Secondary Balance value should have little or no effect on the overall engine air-fuel ratio
Example 1:
Operating Conditions
Primary Injector = 1000 cc/min
Secondary Injector = 1000 cc/min
Required Total Injector Flow = 20.000 ms
Balance Table = 50.0%(Equal flow from both injectors): Primary Injector Flow = 10.000ms
Secondary Injector Flow = 10.000ms
Balance Table = 25.0%( 25% of the flow supplied from Sec Injectors): Primary Injector Flow = 15.000ms
Secondary Injector Flow = 5.000ms
Balance Table = 75.0%( 75% of the flow supplied from Sec Injectors): Primary Injector Flow = 5.000ms
Secondary Injector Flow = 15.000ms
Example 2:
Operating Conditions
Primary Injector = 1000 cc/min
Secondary Injector = 2000 cc/min
Required Total Injector Flow = 20.000 ms
Balance Table = 50.0%(Equal flow from both injectors): Primary Injector Flow = 10.000ms
Secondary Injector Flow = 5.000ms
Balance Table = 25.0%( 25% of the flow supplied from Sec Injectors): Primary Injector Flow = 15.000ms
Secondary Injector Flow = 2.500ms
Balance Table = 75.0%( 75% of the flow supplied from Sec Injectors): Primary Injector Flow = 5.000ms
Secondary Injector Flow = 7.500ms
⚠️ Note
Ideally you want to adjust the the Balance Table so the pulse width and hence duty cycle is the same for both Primary and Secondly Injectors. To calculate the Balance value use the following formula:
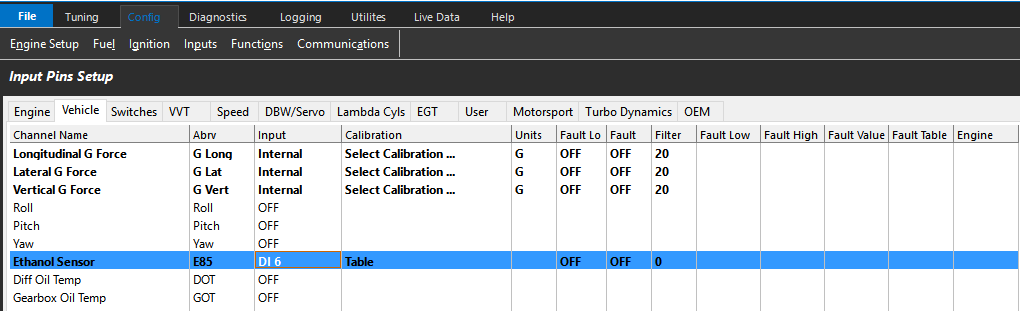
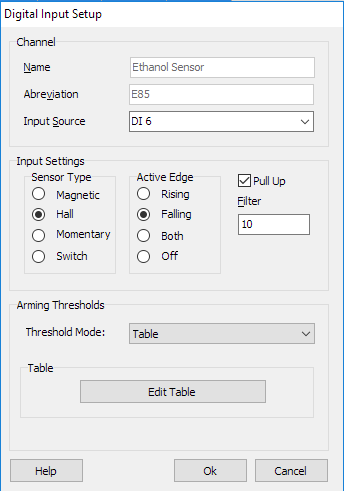
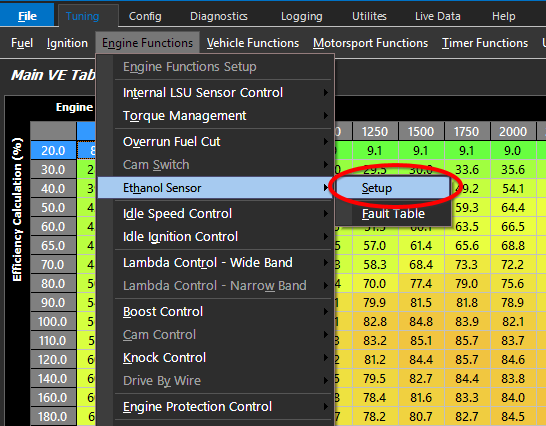
Configure the type of Ethanol sensor used within Emtune software, Tuning -> Engine Functions -> Ethanol Sensor -> Setup
0: GM / Continental
1: FORD
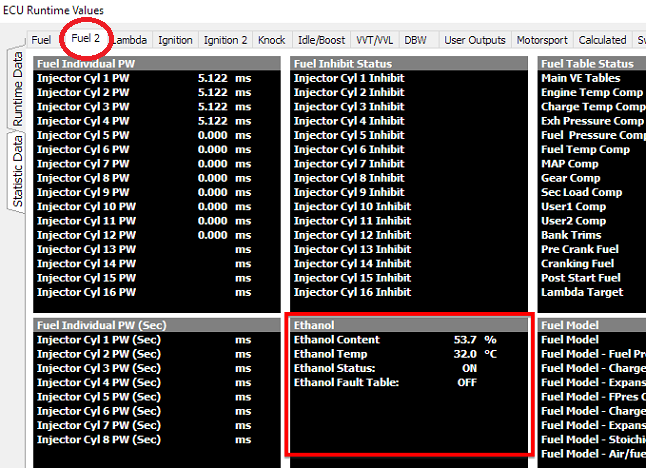
Verify the operation of the Ethanol sensor by pulling up the run time variables by pressing the shortcut key F3 and selecting the Fuel 2 tab.
Step 2
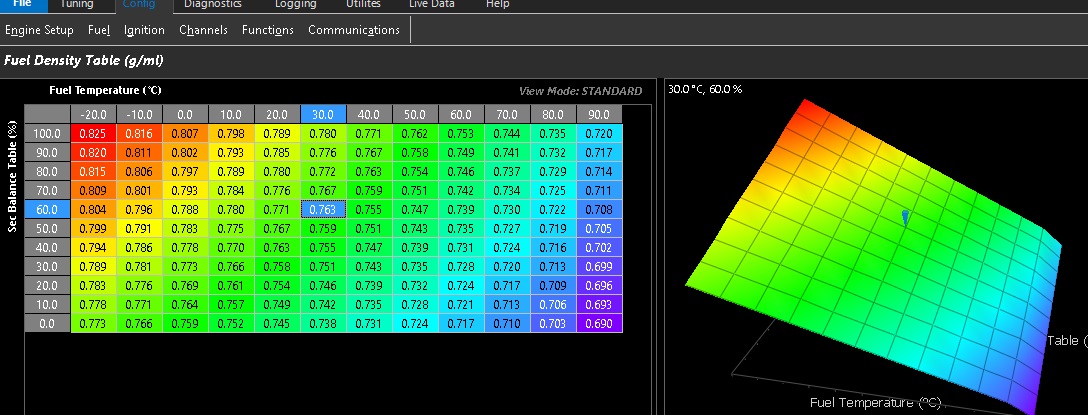
Configure the VE fuel model to load the Ethanol % compensation tables: (Fuel Density Table and Stoichiometric Custom Table)
Preconfigured templates/copies of these tables are included within the Emtune installation package and can be found in the folder C:\Emtron\Table Files
To load these preconfigured tables simply right click within the current table you wish to change and select “Load Table” and browse to the file location listed above.
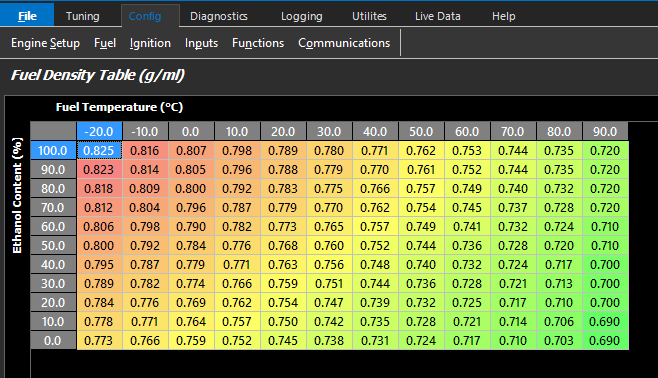
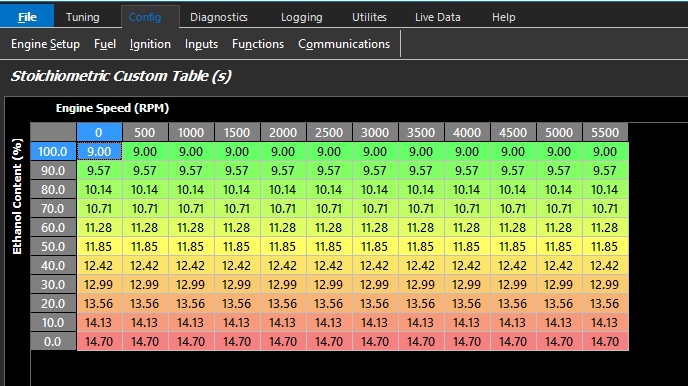
The below tables allows the ECU to accurately make adjustments injector pulse widths based on the characteristics of ethanol based fuel and its different % blends with Gasoline.
To configure this table to go Config-> Fuel -> Fuel Density Table
Configure the custom stoichiometric table which also is based on the Ethanol % of the fuel
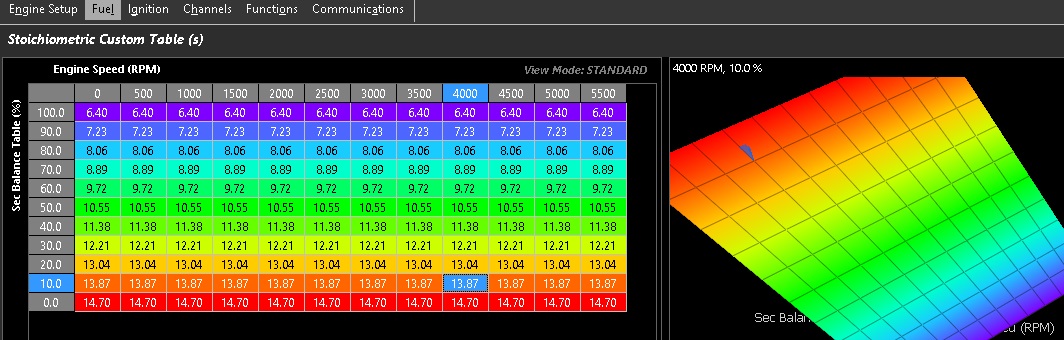
To configure this table to go Config-> Fuel -> Stoichiometric Custom Table
Step 3
Next we go onto configuring the Z-Axis control on the Main Ignition Tables.
This allows the tuner to have the ability to manipulate the tune based on the Ethanol Content % value provided by the flex fuel sensor. This Z-Axis (ethanol %) is used to determine the % blend between the two Main Ignition tables.
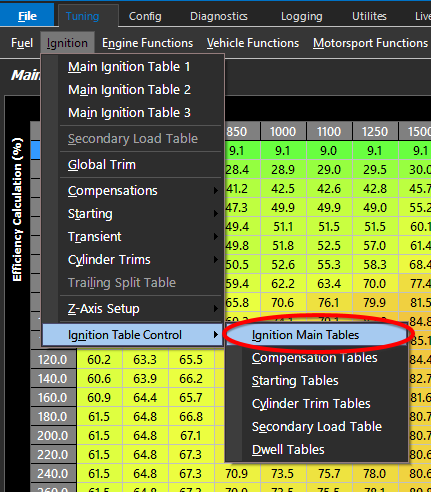
Tuning -> Ignition -> Ignition Table Control -> Main Ignition Tables
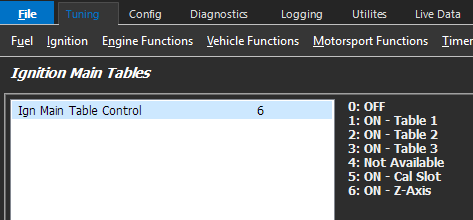
Set the Ignition table control to 6: ON –Z-Axis.
This will activate the Main Ignition Tables1-3 as well as the Ign Main Table Z-Axis Setup table.
Step 4
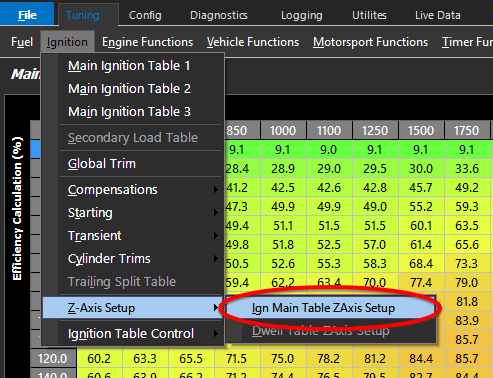
Go to Tuning -> Ignition -> Z-Axis Setup -> Ign Main Table ZAxis Setup
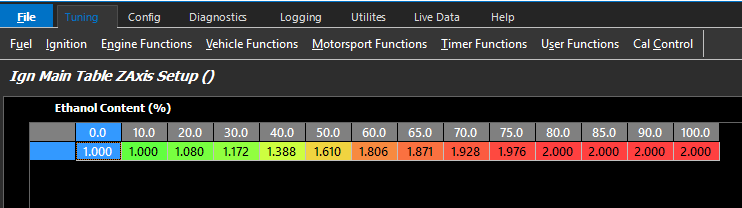
Configure the Ign Main Table Z-Axis setup table such that the X-Axis parameter is Ethanol Content %. (Shortcut key A to access axis setup)
This table controls the percentage of blend used by the ECU between the Main Ignition tables.
A value of 1.0 = use 100% Main Ignition Table1 (Gasoline / pump gas Ignition Table)
A value of 1.5 = use the average value of Main Ignition Table 1 and Main Ignition Table 2
A value of 2.0 = use 100 % percent of Main Ignition Table 2 (E85% tune Ignition table)
The engine should be tuned on 100 % Gasoline (pump gas) and E85 separately and the appropriate Ignition tables populated before attempting to tune any Z-Axis setup tables.
Steps 2 -4 can and should be repeated for other aspects of a Flex Fuel tune. These include:
Starting Enrichment compensation tables
Boost Target Table Control
Map Limit Table Control
Lambda Target Tables
Any table within the ECU that can be spanned against Ethanol Content %
NB:
The VE fuel table should not need any compensation based on Ethanol Content as the Fuel Model accounts for this.
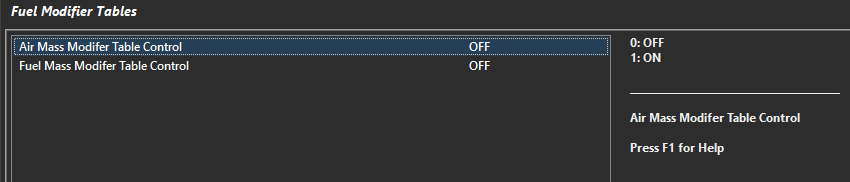
Should you need to make corrections Ethanol % then the Fuel Mass Modifiers table could be used to correct for any inaccuracies in the fuel model. Such causes of error could be attributed to incorrect injector data, inaccuracies in the Flex Sensor and any other sensors in the system the ECU relies on to create an accurate model.
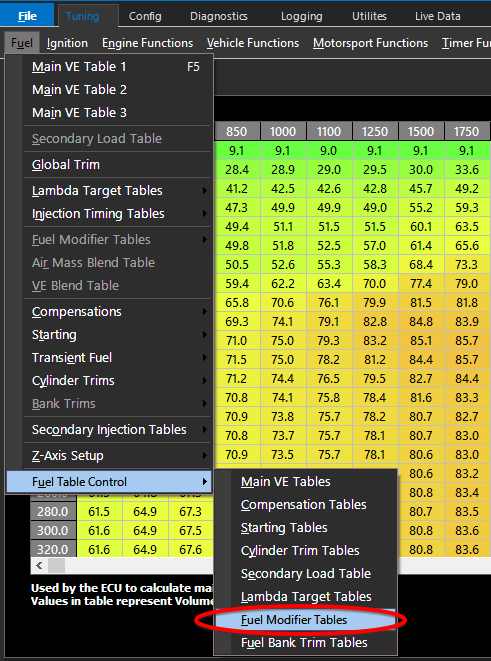
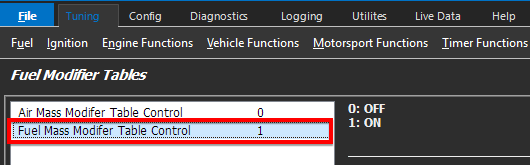
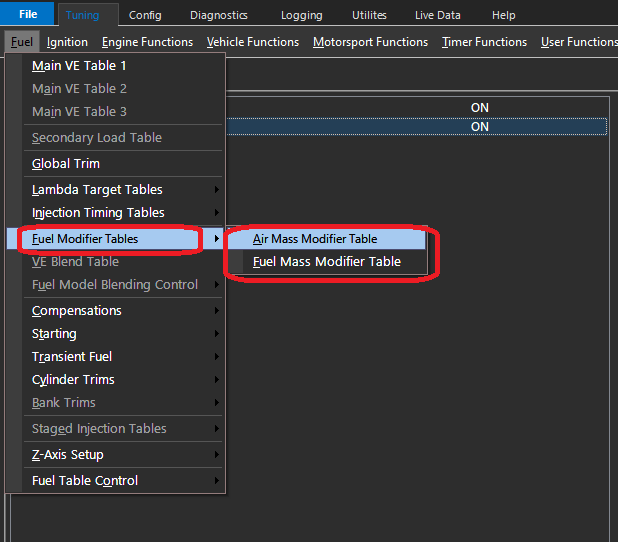
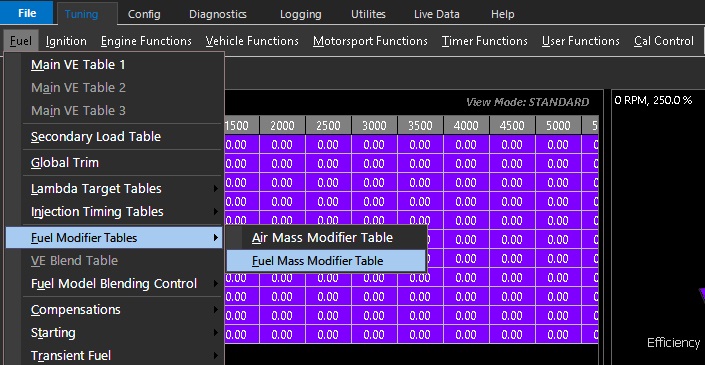
To enable the Fuel Mass Modifier table to go Tuning -> Fuel -> Fuel Table Control -> Fuel Modifier Tables
Enable the Fuel Mass Modifer Table Control set value to 1
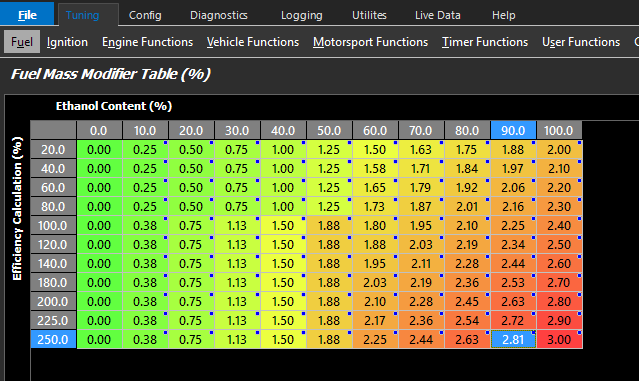
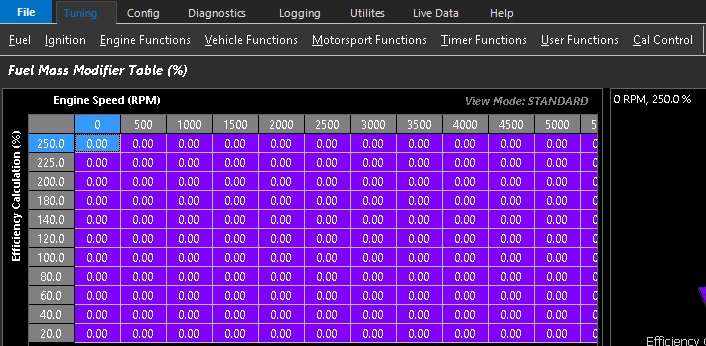
Configure Fuel Mass Modifier Table such that Ethanol Content % on the X-axis and Efficiency Calculation % on the Y-axis Shortcut key (A) to configure table axis. Eg below shows Fuel Mass Modifier Table with percentage trims being applied to the Main VE Fuel Fable
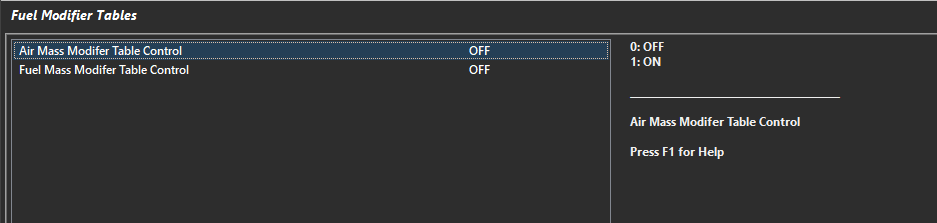
Fuel Modifier Tables
Fuel Modifier tables can be turned on/off.
These tables compensate the raw air mass or fuel mass calculation within the model
OFF – The Compensation Table is Off
ON - The Compensation Table is On
Each compensation table will appear individually under Fuel -> Fuel Modifier Tables
Fuel Mass Modifier Table"
Fuel Mass Modifier Table is enabled via : Tuning -> Fuel Table Control -> Fuel Modifier Tables
Values in this table modify the ECUs Final Fuel Mass directly as a percentage
Z-Axis Setup
Z-Axis Setup
A Z-Axis function allows for a definable blend or swap based on a definable X Axis parameter.
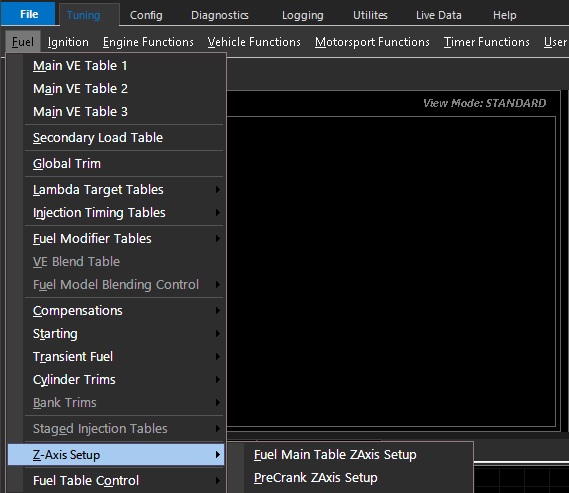
The available Fuel Z-Axis table functions are enabled via Fuel Table Control
Once enabled, the Z-Axis is defined by the user
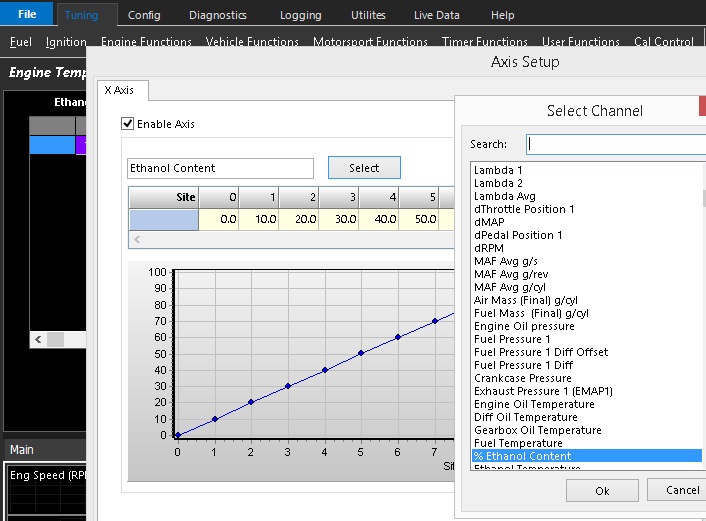
Right mouse click on the table to enter Table Axis setup
Within the Axis setup, any runtime can be selected and utilized as the X Axis
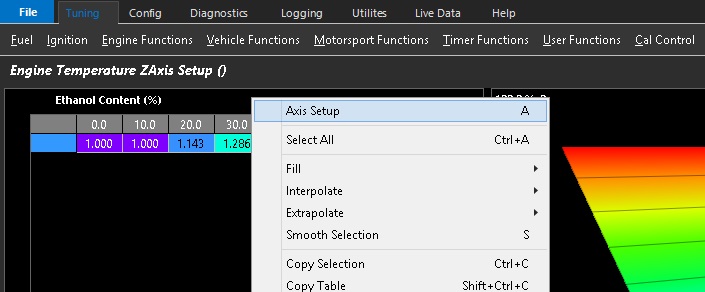
% Ethanol Content runtime shown as an example above
The Ignition Tables are the primary ignition calibration used by the ECU and define the base ignition timing as a function of engine speed and load.
The table values represent the desired ignition timing in degrees Before Top Dead Centre (BTDC) and are typically indexed by Engine Speed (RPM) and Engine Load.
The ECU uses the active Ignition Table as the starting point for all ignition calculations before applying additional ignition corrections, compensations, torque reduction strategies (Strat Modes) to determine the final commanded ignition timing.
Specifications
Units: Degrees BTDC
Minimum Value: -100.0 Deg
Maximum Value: 100.0 Deg
Function Behaviour
Higher values command more ignition advance.
Lower values command less ignition advance.
A value of 0.0 Deg represents no ignition advance before TDC.
Negative ignition timing values represent ignition after TDC (ATDC)
The final ignition timing delivered by the ECU may be modified by additional ignition corrections and compensations, including:
Global Ignition Trim
Coolant Temperature Compensation
Intake Air Temperature Compensation
Knock Control
Idle Ignition Control
Ignition Retard Torque Reductions via User Torque Limits and Strat Modes
Other configured ignition corrections
Important Note - Ignition Timing Synchronisation
Before calibrating the Ignition Table, the ECU ignition timing must be synchronised with the actual engine crankshaft position.
To verify synchronisation:../../config/triggers/crank-index-offset-setup.md
Enable Ignition Lock and set a fixed ignition timing value (Ignition Lock Angle).
Use a timing light to measure the actual ignition timing at the engine.
Compare the timing light reading with the configured Ignition Lock Angle.
Adjust the Crank Index Offset until the timing light reading matches the Ignition Lock Angle. This test should be completed at idle.
Next, verify the ignition timing as engine speed is increased while adjusting the Ignition Delay Time. Correct Ignition Delay Time calibration ensures the commanded ignition timing accurately matches the actual crankshaft position across the complete engine speed range.
Adjustment guidelines:
If the measured ignition timing retards as engine speed increases, increase the Ignition Delay Time value.
If the measured ignition timing advances as engine speed increases, decrease the Ignition Delay Time value.
Once synchronised, disable Ignition Lock and the ECU will accurately command the ignition timing values defined by the Ignition Table and associated ignition corrections.
WARNING
Incorrect ignition synchronisation will result in the ECU commanding ignition timing that does not match the actual engine timing, which can lead to poor engine performance or engine damage.
Global Ignition Trim
This function applies a global ignition timing trim across all ignition channels.
The configured trim value is added to the final calculated ignition timing after all other ignition corrections and compensations have been applied. The trim is applied uniformly across all operating conditions and is independent of engine speed (RPM) and load.
Specifications
Units: Deg
Minimum Value: -100.0 Deg
Maximum Value: +100.0 Deg
Function Behaviour
Positive values advance ignition timing.
Negative values retard ignition timing.
A value of 0.0 Deg applies no global ignition correction.
WARNING
This function is intended as a quick global adjustment to the overall ignition timing.
For permanent calibration changes, adjust the appropriate ignition timing table(s) or compensation map(s). Do not use the Global Ignition Trim as a substitute for proper ignition calibration or long-term corrections.
Compensations
All Ignition Compensations (within the Ignition Tab) are raw degree values added/subtracted onto the Ignition Base Angle Calculation :
Cylinder Trims
Cylinder Trims can be enabled for each cylinder to adjust a timing +/- in a 3D table
Idle Ignition Control
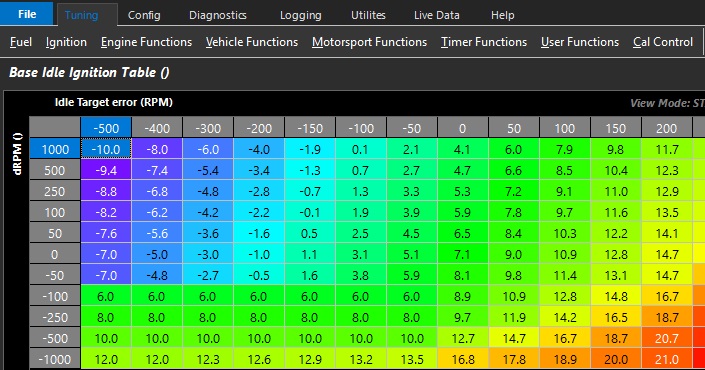
Base Idle Ignition Table
Defines the base ignition angle of the idle ignition control.
This table can be expanded into a 3D look up table using any runtime for axis.
Above example shows the table spanned using Idle Target error & dRPM
Idle Target error references Idle Speed Control Main Idle Target table
** dRPM is the engine Speed rate of change
Ignition Advance Clamp
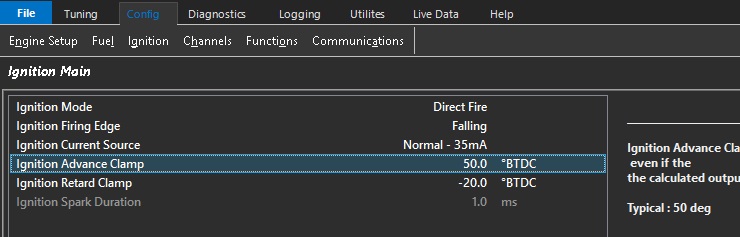
Ignition Advance Clamp
The maximum ignition advance allowed even if the the calculated output is higher.
Typical : 50 deg
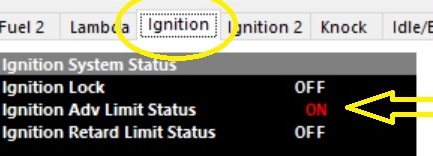
The ECU also provides a Status flag to indication this condition. Open the ECU Runtimes menu (F3) and select the Ignition Tab.
Ignition Advance Rate Table
Ign Advance Rate Table
Globally controls how fast the rate of advance can be applied by the ECU
Units = Degrees/sec
Example:
Ign Advance Rate Table = 500/sec
Ignition Advance Rate of Change = 500 degrees/sec
** This function/parameter is always active
Ignition Main Table Z-Axis Setup
Z-Axis uses a separate X axis lookup that can allow the blending of all the available tables.
Ignition Retard Rate Table
Ign Retard Rate Table
Globally controls how fast the rate of retard can be applied by the ECU
Units = Degrees/sec
Example:
Ign Retard Rate Table = 500/sec
Ignition Retard Rate of Change = 500 degrees/sec
** This function/parameter is always active
Ignition Table Control
Table Control
Emtune has multiple tables for many engine functions. The table behaviour is based on comprehensive selections in Tuning under the respective function (IE, Fuel, Ignition, DBW, Cam control). Some functions have many tables that can be enabled such as Fuel and Ignition tabs. These main functions allow you to enable a variety of compensations, modifiers, individual trims, and more.
For main table controls, the selections are mostly universal.
(Fuel example shown)
Not all of the above example will be available for every function, but generally most functions are the same.
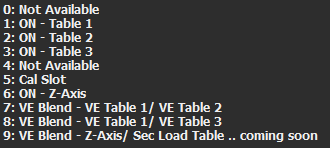
**ON – Table *** enable those respective tables always.
Cal Slot enables which table is currently being commanded by the Cal Slot Control (see Cal Slot Control)
Z-Axis uses a separate X axis lookup that can allow the blending of all the available tables.
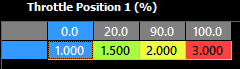
Any runtime can be used, and the units equal which table to run in this case. You can see in the above example the ECU will switch (and interpolate in between) the three different tables available based on TP1 position.
*** Blend** tables allow switching between two tables only.
Transient Ignition
Transient Ignition
Tuning transient functions in Emtune is done through a combination of function setup and table settings.
The following runtimes are generated which are applied/added/subtracted to final base Ignition calculations.
Ignition Rate of Change – The current ignition rate of change in degrees per second
Ign Accel Trim – Ignition retard trim being added by accel trim function
Ign Decel Trim – Ignition advance trim being added by decal trim function
The throttle body model is a key component to unlocking the advanced tuning features of the Emtron ECU. That is Throttle Mass Flow & Torque Modeling & Management. The accuracy of your setup in the throttle body mode is critical for good results. The Throttle Body setup consists of 2 main parts:
Throttle body diameter and scaler.
Throttle body area table.
See the TMF Setup help topic for more information.
Settings are adjusted from the Config -> Air Mass -> Throttle Mass Flow(TMF) Setup menu. Throttle body templates are also available to load into the ECU from the File -> Import Module File menu
See the DBW Torque Management help topic for more information on the process of converting Pedal Position to Throttle Area to DBW Servo target.
The Throttle Body Area Table is a 40-cell calibration table that defines the relationship between Throttle Plate Position (Servo Position) and the corresponding effective Throttle Area.
The table describes how much effective area is available for air to flow through the throttle body at each throttle plate position. This relationship is determined by the physical design of the throttle body and is not linear.
The ECU uses this relationship to:
Convert a Pedal Throttle Area demand into the corresponding Servo Position used as the DBW Target.
Determine the effective throttle area available at a given Servo Position for Throttle Mass Flow (TMF) calculations.
Accurate calibration of this table is critical to Throttle Mass Flow calculations and therefore to ECU functions that depend on accurate throttle airflow estimation, including:
Idle Control
Cruise Control
Torque Management
Throttle Control
Air Mass Modelling
See the TMF Tuning help topic for more information on Throttle Mass Flow Tuning.
Example:
Pedal Throttle Area Demand = 4.37%
Using the table in the below image, the ECU would find the 4.37% area and correlate this to 9.0% Servo Position. The DBW Servo Position Target therefore becomes 9.0%
i.e the ECU is asking for 4.37% area and moves the throttle plate to 9.0% servo position to achieve this.
Nissan GT-R R35 Throttle Body Area table is shown above.
**Throttle body templates are also available to load into the ECU from the File -> Import Module File menu
There are multiple ways to calibrate the appropriate throttle area.
Method 1 – MAF verification
If the application is using a calibrated MAF sensor. Then the throttle area % can be adjusted and matched to TMF air mass VS MAF air mass at different throttle/DBW servo positions.
Method 2 – Matching Lambda
If no MAF sensor is available, setting fuel trims to 0 (or near 0), you can adjust the throttle area to match the target mixture very quickly.
** The only way to truly validate error in the TMF calculation is to use Method 1
** Some extreme applications where live Lambda is unstable may be more difficult to map with Method 2
Tunining Tip
Per the Matching Lambda validation method, the Throttle Area Table can be quickly tuned while the engine is operating in TMF. Adjust the table values at the relevant throttle areas until the measured Lambda matches the Lambda Target Table for the corresponding operating conditions.
Before performing this validation:
Turn Wideband Lambda Control off.
Set the TMF Blend Bias to 100% TMF.
Adjusting the Throttle Area Table changes the effective throttle area used by the TMF model and therefore the calculated airflow. When the measured Lambda consistently matches the Lambda Target Table across the operating range, the Throttle Area Table has been practically validated for engine operation in TMF.
Throttle Mass Flow (TMF) as the name indicates, is the rate at which air mass is flowing through a throttle body in units of grams/second (g/s).
The flow through a throttle body is governed by three physical elements:
Conversation of mass
Newtons second law of motion for fluids
Conservation of energy
By combining all these elements the ECU can model the flow of fluid through the throttle body accounting for throttle plate thickness and throttle shaft size. One key piece of data is knowing the pressure ratio across the throttle body as shown in the below diagram, the other key piece of data is the current throttle area. If the pressure ratio and throttle area is known, the ECU can very accurately calculate the mass flow rate through a throttle body.
Although the ECU completes these complex calculations internally, the process of calculating Throttle Mass Flow is kept as simple as possible for the user with the following inputs and setup required:
Inputs required
Pressure Before the throttle Plate
Pressure After the throttle Plate
Setting required
Throttle Body Size
Throttle Area to Servo Position Correlation Table (Throttle Body Area Table)
The TMF calculation can summarised in the below equation :
Throttle Mass Flow (g/s) = ( Pafter / Pbefore) x Throttle Area x Modelled throttle body fluid dynamics equation
Throttle Mass Flow Idle Speed Control
The Throttle Mass Flow (TMF) idle speed control function delivers extremely accurate and rapid idle calculation based on actual engine’s airflow requirements. Any engine load change will be detected by a pressure ratio change across the throttle body allowing the ECU to make instantaneous corrections. In all DBW applications we strongly recommend that the TMF Idle speed control is employed. TMF Idle speed control is an independent idle speed control function that utilises the Emtron’s comprehensive air mass flow modelling without effect on the fuel model used.
The Throttle Mass Flow (g/s) becomes the target flow for the Idle Speed Control system i.e how much air mass flow is required for a given target rpm. So the TMF becomes the feed-forward/Initial value. The ECU will then apply a PID correction to this flow target until the Target RPM is reach. By rearranged the TMF equation, the ECU will convert the final Throttle Mass Flow(g/s) into Throttle Area and move the plate to that position. A feed-forward/Initial value table example is shown below.
Typical TMF Idle Feed forward table in units of g/s
NOTE:
Any fuel model mode can be selected and does not need to include TMF for the TMF idle speed control function to work correctly.
TMF fuel model is covered in the Fuel section and not discussed here.
Warning - DBW setup must be completed before setting up TMF idle
Throttle Mass Flow Tuning
Overview
Throttle Mass Flow (TMF) as the name indicates, is the rate at which air mass is flowing through a throttle body in units of grams/second (g/s). Using the throttle body size, throttle area, temperature, pre and post throttle pressures,the ECU can very accurately calculate air flow through the throttle body and therefore into the engine; this is known as the TMF Calculation. Other sensors that also generate air mass flow (g/s) data are Manifold Pressure and MAF sensors. The TMF Calculation is just another method of determining air mass flow and has benefits over MAP and MAF as discussed further down.
The image below illustrates the basic elements required to calculate TMF.
Getting into more detail, the flow through a throttle body is governed by three physical elements, Conversation of mass, Newtons second law of motion for fluids and Conservation of energy. By combining these elements the ECU can model the flow of fluid through the throttle body accounting for throttle plate thickness and throttle shaft size. By then including real-time data such as the pressure ratio across the throttle plate and the instantaneous throttle area, the ECU can precisely calculate the mass flow rate through a throttle body.
Although these calculation are complex, the TMF setup process for the user is kept as simple as possible with the following inputs and setup required:
Example: TMF Airflow Validation and Blending Workflow
Use the following workflow to validate TMF airflow, calibrate the Throttle Body Area Table, and correctly blend TMF with alternative air-mass calculation methods.
1. Base Engine Setup
Ensure the fundamental engine configuration is correct before beginning TMF calibration.
Engine displacement
Injector data
Engine configuration and cylinder setup
Other parameters required for accurate air-mass and fuel calculations
2. Throttle Body Setup
Ensure the throttle body configuration and control are correctly established.
Correct throttle body size and configuration
Throttle position calibration
Throttle control PID tuning fully validated
Throttle operation stable and repeatable across the operating range
3. Sensor Configuration and Calibration
Verify that all sensors required by the TMF model are correctly selected, assigned, calibrated, and installed.
Pre-throttle MAP
Correct sensor assignment
Correct calibration
Correct physical installation and pressure reference
Post-throttle MAP
Correct sensor assignment
Correct calibration
Correct physical installation and pressure reference
IAT
Correct sensor assignment
Correct calibration
Correct sensor location
4. Enable and Configure TMF
Once the engine, throttle body, and sensors have been validated:
Select and assign the correct sensors.
Enable the TMF Air Mass Model.
Verify that all required TMF inputs are valid and responding correctly.
Confirm that the calculated TMF airflow is reasonable before proceeding with calibration.
5. Air Mass Model
Select the required Air Mass Model.
6. Outflow Function
The Outflow function drives the TMF calculation at pressure ratios near 1.0. See the help article on TMF Outflow for more detail.
If the Outflow Reference and Outflow Measured values are scaled correctly, the Throttle Air Mass will read very close to MAP Air Mass (speed density) as above. With correctly scaled Outflow, it’s possible to use TMF 100% of the time (though this may not always be desirable).
Outflow Reference uses (references) the VE value, so before setting the scaler, ensure that the MAP Air Mass, at least near pressure ratios of 1.0, is accurate.
Adjust the Outflow Reference Scaler so that the Throttle Air Mass is the same as or just slightly under the MAP Air Mass.
Info
The scaler has an inverse effect on Throttle Air Mass:
Increasing Outflow Reference Scaler will reduce Throttle Air Mass.
Decreasing the Outflow Reference Scaler will increase Throttle Air Mass.
In the above image:
At lower Throttle Effective Area & Throttle Pressure Ratio’s, Outflow Measured is highest and is driving Outflow Final.
Near pressure ratio’s of 1.0, Outflow Reference is highest, and takes control of Outflow Final.
At WOT, where Outflow Reference is dominant, the Reference Scaler is set so that Throttle Air Mass is very close to MAP Air Mass.
Low Throttle Area / Pressure Ratio: Air Mass Final = Throttle Air Mass.
High Throttle Area / Pressure Ratio: Air Mass Final = MAP Air Mass.
Tip
It’s better to adjust the Reference Scaler from a full full power run log, rather than from a single stead state zone.
A correctly configured TMF Outflow Reference Scaler should also translate to torque calculations. Torque can also be used as a “compare” channel. In some cases, this allows you to validate torque calculation, frictional losses, etc - at the same time.
7. Air Mass Model Blending Table
This table controls where the Air Mass Final runtime comes from:
0.0% = Air Mass Model Calculation 1 (eg: Speed Density)
100% = Air Mass Model Calculation 2 (eg: Throttle Mass FLow (TMF))
50.0% = Interpolate half way between Calculation 1 & Calculation 2.
Non Conventional VE Tables
Depending on the specific application, and the throttle area demand/effective area vs pressure ratio, you may find that all of, or most of the part-throttle SD VE table is no longer necessary. This allows for non-conventional VE tuning to be used. In many cases, the entire load axis of the VE table can be turned off (or set to something other than MAP/Load) as it’s no longer needed.
An example of a non-conventional VE table. This engine runs in TMF below WOT. As WOT approaches it blends into Speed Density. The cam position is dynamically accounted for in the VE table. The expansion ratio correction is used to account for changes in VE as boost increases. As an added bonus, tuning this way informs the optimal cam position by following the high spots in the VE table.
8. Tuning the Throttle Body Area Table
The Throttle Body Area table tells the ECU how much actual throttle area exposed to flow air at different throttle positions. The relationship to throttle position is not linear. This is key to the ECUs Torque Management functions, as accurate air mass measurement and actual engine torque go hand in hand.
For torque management, Throttle Area Demand can be manipulated which will be directly proportional to air mass when this is configured correctly
This 2D table is all that is needed to appropriately map the given throttle area vs throttle position. As mentioned previously, this allows for extremely fast and accurate mapping of the engine when TMF is active.
Important
It is important to understand that the Pedal Demand and other targeting of throttle area will target the “unit location” in this table, which will then correspond to the DBW Servo Position. This means, there could be little relationship between Throttle Area Demand and actual DBW Servo Position on fully tuned setups.
There are multiple ways to calibrate the appropriate throttle area:
Method 1 – Matching Lambda
Ensure fuel trims are 0 and closed loop lambda is off.
Blend the fuel model into 100% TMF.
Hold the engine at a stead state, high enough that air flow is reasonable stable (eg: 3000 RPM).
Adjust the throttle area table so that measured Lambda matches Lambda Target.
Tip
Tune Speed Density at WOT first: At higher throttle pressure ratios, where Outflow Reference is influencing Outflow Final, MAP Air Mass already be accurate or the error will be baked into the Throttle Area Table.
Method 2 – Matching other forms of Air Mass measurement
If the application is using a calibrated MAF sensor. Then the Throttle Area % can be adjusted and matched to so that Throttle Air Mass matches MAF Air Mass at different throttle/DBW servo positions. The same can be done matching Throttle Air Mass to MAP Air Mass.
Important
MAF and/or MAP Air Mass must be validly running the engine - running the commanded lambda target, etc.
9. Validating Throttle Area Torque
Another way to validate Throttle Area and TMF Torque, is to force the ECU into a “Torque Management” function. The Calibrate Throttle Area setting in Throttle Mass Flow Setup does exactly this. It allows you to set a fixed throttle torque limit (eg: 300nm). When this torque limit is driven into, the ECU will use TMF and the Throttle Area Table to try and limit the engine torque to the configured value.
Once a torque limit is set, the “Engine Torque TMF” channels should match the standard Engine Torque channels, otherwise the Throttle Area table is incorrect.
Example of where Engine Torque TMF and Engine Torque are not matching due to incorrect Throttle Area settings.
Corrected Throttle Area table so Engine Torques further aligned.
10. TMF Correction Table
This correction table essentially exists to help remove an error remaining in the system across a wide variety of load & rpm conditions. Start with the whole table set to 0, and adjust if necessary.
Throttle Mass Flow Outflow
Overview
The Outflow Function describes the relationship between the pressure ratio across the throttle and the amount of air that can flow through it.
As the pressure ratio changes, the relationship between pressure and airflow also changes. The Outflow Function models this behaviour and forms a critical part of the modelled throttle body fluid dynamics used in the TMF (Throttle Mass Flow) calculation.
See the TMF Setup help topic for more information on Throttle Mass Flow Setup.
See the TMF Tuning help topic for more information on Throttle Mass Flow Tuning.
The ECU calculates two Outflow values:
Outflow Measured - Directly calculated from the Throttle Pressure Ratio.
Outflow Reference - Generated by referencing the engine’s rpm, VE at an assumed pressure ratio of 1.000.
The Outflow Measured value can become unstable as the Throttle Pressure Ratio approaches 1.000. To maintain a stable and accurate TMF calculation, the ECU can blend the Outflow Reference value into the calculation in this region. The blend will start when the Outflow Reference becomes higher in value than Outflow Measured.
In summary, the TMF calculation blends between Outflow Measured and Outflow Reference under various conditions.
Outflow Reference Scaler
The TMF Outflow Reference Scaler scales the Outflow Reference value. The goal is for the ECU to smoothly transition to the Outflow Reference when the Outflow Measured value becomes unstable.
There are many contributing factors to the scaler value, but the single biggest one is the number of cylinders:
The TMF Outflow Measured Correction Table allows the Outflow Measured value to be scaled using a percentage correction. The primary purpose of this correction is to apply a negative adjustment, reducing the Outflow Measured value and allowing the Outflow Reference value to be blended into the TMF calculation earlier.
Tuning Tip: Outflow Reference Tuning
The simplest way to set this value is to compare Throttle Air Mass to Speed Density (MAP) Air Mass at throttle pressure ratios close to 1.000. Adjust the Outflow Reference Scaler so that the Throttle Air Mass is the same as, or slightly lower than, the MAP Air Mass at a pressure ratio of 1.000.
When the throttle body size is well matched to the engine, this condition should typically occur at or near WOT.
MAP Air Mass MUST be valid and meeting lambda targets.
Tuning
For more information on tuning both the Outflow Measured and Outflow Reference, refer to Section 6 in TMF Tuning
Before looking at the Torque data available in the ECU, it is important to understand why Torque is such a fundamental parameter within the ECU.
The majority of the ECU functionality operates on Torque, specifically through Torque Reduction. Instead of simply applying a fixed amount of throttle closure, ignition retard or engine cut, functions such as Traction Control and Launch Control can request a specific amount of torque reduction. The ECU then uses the configured Torque Reduction Strategies (Strat Modes) to calculate how to achieve the requested reduction. These strategies are user configurable and use three primary methods to reduce torque:
Throttle (TMF): Using the TMF Air Mass Model the ECU can calculate the throttle area required to achieve the requested torque reduction.
Ignition Retard: Using the Ignition Retard Scaling Table, the ECU calculates the amount of ignition retard required to achieve the requested torque reduction.
Engine Cut: Using the Cut Gain Table, the ECU calculates the amount of engine cut required to achieve the requested torque reduction.
: The ECU uses the calculations within the Engine Torque Model to precisely determine the throttle area, ignition retard or engine cut percentage required to achieve the requested torque target. The required value is calculated directly and applied instantly, rather than using a slow closed-loop process to progressively adjust the torque reduction.
: Importance of Accurate Torque Modelling
Because torque-based control functions rely on the calculated engine torque, the accuracy of the Engine Torque Model is critical. If the calculated torque does not accurately represent the actual engine torque, a requested torque reduction may not produce the expected change in engine output. This can result in torque control functions being either too aggressive or insufficient. The Air Mass Model is a primary input to the Engine Torque Model. Accurate calibration of the Air Mass Model is therefore essential for accurate torque calculation and reliable torque control.
The engine torque produced by combustion is calculated by the ECU using modelled algorithms and is referred to as Ideal Engine Torque. The moving parts inside the engine assembly create drag and therefore limit the torque available at the crankshaft. The estimated torque required to overcome this drag is called Frictional Loss.
The ECU also produces a calculation for Driver Demand Torque using a weighted mathematical model from multiple inputs. This is explained further down the page.
Important Note:
The Engine Torque and Driver Demand Torque calculations have no direct correlation and are calculated independently. Under normal operating conditions, both calculations will generally converge and track closely. The accuracy of both calculations depends on the accuracy of the engine setup and calibration, including Injector Data, Fuel Density, Air Mass Model, and other relevant parameters. The ECU calculates torque in Newton-metres (Nm).
The Engine Torque andDriver Demand Torque data can also be transmitted over the CAN bus for some OEM applications. Accurate torque modelling is therefore particularly important when responding to transmission torque reduction requests, where the transmission relies on accurate torque information and controlled torque reduction.
Engine Torque (Nm)
The primary input used to calculate Engine Torque is the Final Air Mass (g/s) entering the engine. The Final Air Mass will be heavily influenced by the Air Mass Model, the VE table and Injector charachterisation so this data must be as accurate as possible to ensure the accuracy of the Engine Torque calculation.
Ideal Engine Torque is calculated using the following inputs:
Final Air Mass (g/s)
Throttle Area
Lambda Target
Stoichiometric Ratio
Number of Cylinders
Compression Ratio
Compression Ratio: For a given Final Air Mass and Lambda Target, an engine with a higher Compression Ratio will generally produce more torque than an otherwise equivalent engine with a lower Compression Ratio. This is because the higher compression ratio allows the combustion process to convert a greater proportion of the available energy into useful mechanical work. The ECU applies an internal Compression Ratio Correction to account for this effect.
Uncorrected Engine Torque is calculated by accounting for the frictional loss of the engine. It is named “uncorrected” because other inputs can further change the Engine Torque. An Engine Torque Correction factor can also be applied and is described further down the page.
Final Engine Torque accounts for the additional inputs that can reduce or increase Engine Torque such as:
Engine Cutting (Reduce Engine Torque)
Ignition Retard (The Torque Model assumes the engine has the Ignition tuned for peak torque, so any retard will therefore reduce Engine Torque)
Throttle (Throttle Mass Flow function(s) can close the throttle plate, reducing the Air Mass and hence Engine Torque. For example VDC control)
Nitrous (This will increase Engine Torque)
Driver Demand Torque (Nm)
The Driver Demand Torque is the torque requested by the driver, primarily as a function of engine speed and pedal position to give a requested throttle area. We know through mathematical modeling that from throttle area we can calculate airflow and from airflow we can calculate torque.
Apart from some specific exceptions, the engine torque must be controlled by the driver. Some exceptions include: downshifts, traction control (VDC event), pit lane speed limiter and cruise control.
The driver only has control of torque by using the pedal, but other factors get included into the mathematical model to give a final Driver Demand Torque. These include:
Engine Speed
Throttle Area and Diameter
Engine VE
Charge Temperature
Peak Manifold Pressure (Used as peak load indicator). See Torque -> Drive Demand Torque -> Peak Manifold Pressure Estimate.
Lambda Target
Number of cylinders
Compression Ratio
All those parameters get included in a complex mathematical model which generates a runtime called Driver Demand Torque Ideal.
Accounting for frictional loss of the engine the final Driver Demand Torque can be expressed as:
This is a critical parameter used in the Driver Demand calculation. The ECU compares the current Manifold Pressure against the expected peak value to determine a pressure ratio. This ratio is then used as a weighted scaler within the mathematical model to derive Driver Demand Torque.
Think of this value as a load indicator — it represents how close the engine is to its expected maximum manifold pressure.
The table can normally use 1:1 scaling, with the axis spanning the expected pressure range:
For a normally aspirated engine this is barometric pressure.
For a turbo charged engine this is normally the boost target.
Torque Runtime Data
Engine Torque and Driver Demand Torque data is available in the Runtime Values(F3) > Torque Data tab.
Firstly, the Engine Torque values must be validated on a dyno to ensure the ECU Torque Calculation (Engine Torque Ideal, Engine Torque), are close to the values being produced on the dyno.
Note: If using a dyno where wheel power is reducing values, then this error must be factored in.
A properly tuned engine, with no error in the basic air mass model is the first step. Having proper injector data, engine displacement, fuel type/stoich, and a tuned VE table will already calculate accurate engine torque.
Engine Torque Correction Table
If engine torque is not calculating accurately, you can correct the torque calculation via the Engine Torque Correction Table.
Tip: A value of 1.0 = no correction.
Driver Demand Torque Correction Table
Driver Demand channel is used in some OEM applications, but also can be used as a channel in the ECU to feed forward the driver tour requests. The Driver Demand can be corrected via the Driver Demand Torque Correction Table.
Tip: A value of 1.0 = no correction.
Torque Management Setup
Overview
Please refer to Torque Modelling for more information on how the ECU generates Engine Torque and Driver Demand Torque data.
For Torque Tuning information please refer to Torque Tuning
Torque Reduction Ignition Retard Clamp
This clamp value sets the maximum amount of ignition timing retard the ECU is able to apply during a torque reduction event.
Typical value is 40.0 degrees of retard.
: WARNING: An insufficient clamp value may prevent the ECU from achieving the requested torque reduction, resulting in a failed torque reduction event.
Torque Nitrous Gain
When Nitrous is used to increase engine torque, the ECU automatically calculates the resulting additional Air Mass introduced by the Nitrous system.
In some applications, the calculated torque increase may require a small amount of scaling to account for differences between the modelled and actual engine response. The Torque Nitrous Gain setting can be used to trim the calculated torque increase and improve the accuracy of the Engine Torque Model.
Default Value = 1.00 ( No Scaling)
For example: Torque Increase-Nitrous = 100 Nm
Torque Nitrous Scaler = 1.25
“Torque Increase-Nitrous” final value after scaling 125Nm
Torque Limit - Ignition Retard Scaling Table
During a Torque Reduction Request, the ECU can reduce engine torque by retarding the ignition timing from the **MBT (Minimum spark advance for Best Torque) ignition angle.
To achieve the requested torque reduction, the ECU needs to understand the relationship between the percentage of torque reduction and the required Ignition Retard. The Torque Limit - Ignition Retard Scaling Table defines this relationship.
The X-axis represents the requested Torque Reduction (%), and the table value represents the corresponding Ignition Retard (°) required to achieve that level of torque reduction. The default values are suitable for most applications.
Example: The engine is producing 600 Nm and a Torque Reduction to 420 Nm is requested.
This represents a 30% reduction in torque, 600 Nm → 420 Nm = 30% Torque Reduction.
Interpolating the table at 30% Torque Reduction determines that approximately 20° of Ignition Retard is required to achieve the requested torque reduction.
Torque Limit - Cut Gain Table
During a Torque Reduction Request, the ECU can reduce engine torque by applying Engine Cut.
This setting defines the relationship between Engine Cut (%) and the resulting Torque Reduction (%). The table value represents the percentage of Torque Reduction achieved for every 1% of Engine Cut.
Example: The engine is producing 600 Nm and a Torque Reduction to 420 Nm is requested.
Engine Torque at 600Nm.
Requested Torque Reduction = 180 Nm
Requested Torque Reduction = 30%
1.0 %/ %Cut. ECU will cut engine at 30%
0.8 %/ %Cut. ECU will cut engine at 37.5%
1.2 %/ %Cut. ECU will cut engine at 25%
Torque Limit - Boost Target Margin Table
During Throttle Mass Flow Limiting, the ECU calculates the Minimum Boost Target required for the engine to achieve the requested torque.
The boost pressure must be higher than this minimum for Throttle Mass Flow Limiting to operate effectively. The Boost Target Margin is therefore added to the calculated Minimum Boost Target to provide the required headroom.
Example:* The ECU calculates a Minimum Boost Target of 150 kPa. If the Boost Target Margin is set to 20 kPa, the final Boost Target during Throttle Mass Flow Limiting will be:
150 kPa + 20 kPa = 170 kPa
Torque Limit - Target Calibrate
Use to Calibrate the Torque Limt Function. Use this function with CAUTION.
Enter a Torque Limit value to calibrate the system. This setting ALWAYS gets cleared at power-up
This will Override the CAN Torque Limit Request data, use the F3 Runtime menu to view data,
-1000.0 Nm = OFF
Torque Limit - Strat Calibrate
Used by the Torque Limit - Target Calibrate setting to determine which Torque Reduction Strategy (Strat Mode) is used to apply the requested torque reduction.
(If a value out this range is ued, the function will not operate)
0 = OFF
1 = Strat Mode 1
2 = Strat Mode 2
3 = Strat Mode 3
4 = Strat Mode 4
5 = Strat Mode 5
Engine Torque Correction
Engine Torque Correction Table
The ECU accurately calculates the Engine Torque, however if any calibration errors lead to incorrect readings, this table allows the user to adjust the gain based on any parameter listed in the axis setup form.
The range is 0.000 to 2.000, a value of 1.000 being equivalent to the calculated torque demand without correction. The default table is produced using only the X axis as an example. The Y axis is available and can be enabled at any time in the axis setup form.
During engine cranking (Engine Speed < Crank Exit RPM setting) this table is used to generate a Throttle Area Demand ,overriding any request from the pedal. The ECU then uses the Throttle Body Area table to convert Throttle Area into the DBW Servo Position target.
See the DBW Torque Management help topic for more information on the process of converting Pedal Position to Throttle Area to DBW Servo target.
This table is available from the Engine Functions -> Torque Management -> Cranking Throttle Area Demand menu.
Cranking Throttle Area Demand data
This is available from the runtime (F3) menu , Torque or DBW 1/2 tab.
Frictional Loss Tables
Overview
The engine torque produced by combustion is calculated by the ECU and referred to as “Ideal” Engine Torque. The moving parts within the engine have mass and are subject to frictional losses and therefore limit the actual torque available. As such, the estimate of torque required to overcome this drag effect is called Frictional Loss. This estimate is found in the Frictional Loss Table in units of Nm. A default table is provided as a guide to be adjusted (See below)
Frictional loss is instrumental in torque management tuning. If any function in the ECU requires torque targeting, feeding error here will cause the system to not function correctly.
These internal torque losses are mainly influenced by the cylinder count i.e. the more cylinders you have, the more moving parts and therefore more friction & the more parasitic loss of torque.
Calibrating Frictional Loss
The engine must be fully mapped and calibrated before editing the Frictional Loss table.
Tuning Tip:
A simple way to obtain a close representation of engine friction is to run the engine in neutral, with no external load on the engine, and adjust the Frictional Loss value at each RPM point until Engine Torque (Uncorrected) is approximately 0 Nm. This represents a condition where the engine is neither accelerating nor decelerating.
i.e. Vary the engine speed in neutral and adjust the Frictional Loss table at each RPM point until Engine Torque (Uncorrected) = 0 Nm.
All the Torque Data can be viewed from the Runtime menu (F3), Torque Data tab.
This procedure teaches the ECU how much Ideal Torque is required to achieve different engine speeds. This is instrumental in RPM targeting functions used to achieve or maintain a specific RPM, such as RPM Limiting, Launch Limiting, and other RPM control functions.
Tuning -> Engine Functions -> Torque -> Frictional Loss Table
Frictional Loss Offset Tables
There are two tables that allow offsetting of the frictional loss. One typical example will be adjusting the loss based on oil temperature.
Important Notes:
Engine temperature, oil temperature, and other factors can significantly affect frictional losses. Two offset tables are available to compensate for these factors.
Errors in the Air Mass Model or basic engine setup will cause the calculated base torque values to be incorrect. Before tuning the torque model, ensure there is no significant difference between Lambda Target and Actual Lambda. This provides a useful validation that the Air Mass Model is correctly calculating engine airflow.
Pedal to Throttle Area Demand Translation
Introduction
As discussed at the beginning of this section DBW Torque Management the ECUs Torque Management using DBW requires the plate control to be in Throttle Area, not Throttle position.
Pedal to Throttle Area Demand Translation Tables
Pedal to Throttle Area Demand translation is performed using a 3D table. Three tables are available, only 1 can be active at any one time.
NOTE: This table targets Throttle Area (NOT DBW Servo Position)
The relationship of Servo Position should be ignored with a properly tuned Throttle Body Area system in the Throttle Body Model. Torque targeting should be the overall mentality of this map, and while with everything configure as it should (TMF, etc), linearized table may produce linearized Driver Demand, this may not be ideal for how the vehicle will want to drive. More often than not the demand table will end up in a shape where the higher end of the table (60+) has much larger values in it - to demand more torque.
The Y-Axis runtime should be spanned using “Pedal Position Demand” which is a filtered version of the raw Pedal Position sensor. See Pedal Position Demand Filter
A typical runtime for the X-Axis is Engine Speed.
Pedal to Throttle Area Demand Translation table
Pedal to Throttle Demand Translation Clamp Table
This is a 3D table that clamps the maximum allowable throttle area. If no clamping of the Throttle Demand is needed, a single value of 100% can be used.
Two examples are shown below.
Basic Throttle Area clamp table (no Throttle Demand Clamping is needed)
Advanced clamp table (based on Traction Target Error and Ground Speed Limiter)
Pedal to Throttle Area Demand Translation Table Control
As mentioned at the start, there are 3 tables which can be control in a variety of ways. The following options are available
0: N/A (Tables OFF)
1: ON – Table 1 (Table 1 Available)
2: ON – Table 2 (Table 2 Available)
3: ON – Table 3 (Table 3 Available)
4: N/A
5: Cal Slot (Cal Slot Control selects active table)
6: ON – Z-Axis (Z Axis Table selects/blends active table)
7: ON – Table 1 = DBW 1/Table 2 = DBW2 Air Bleed
Modes 1-3: Activate individual tables
** Mode 1 is most common (Table 1 activated)
Mode 5: Allows Cal Slot Control to select the active table (See Cal Slot Control)
Mode 6: Enables a Z-Axis table that allows selection/blending of the active table,
Axis based on Front Axle Speed. Units are active table
Mode 7: Allows two different drive by wire servos to have different targets. DBW Servo 1 controlling the main airflow into the engine, and DBW Servo 2 being used for a different purpose like DBW Air Bleed on turbocharged or supercharged engines.
Example
Pedal to Throttle Demand Translation Table 1 = DBW 1 Control .
Pedal to Throttle Demand Translation Table 2 = DBW 2. This is used for compressor surge control by venting excess air the engine cannot use.
This is a good example of how Emtron allows you to layer multiple functions together to obtain a desired result
Pedal Position Demand Filter
Introduction
The ECU takes the raw Pedal Position Sensor 1 input, passes it through exponential filter to help smooth out signal fluctuations, then generates a new runtime Pedal Position Demand.
Pedal Position Sensor -> EXPONTENTIAL FILTER -> Pedal Position Demand
The filter coefficients for the exponential filter are adjustable using a table. These filter coefficients can be used to heavily filter small throttle corrections, while allowing large throttle changes to have little or no filtering. By heavily filtering small throttle corrections, throttle sensitivity can be reduced, helping the throttle “feel” when driving over bumpy roads or when making small throttle changes. Little filtering when making large throttle changes helps to give a fast throttle response when a large acceleration or deceleration is requested.
See the DBW Torque Management help topic for more information on the process of converting Pedal Position to Throttle Area to DBW Servo target.
Pedal Position Demand Filter Lockouts
These settings allow for the lockout of the pedal filter based on the pedal position.
Pedal Position Demand Filter Table
This controls how much filtering is applied. It is common to filter heavily at low rates of pedal position sensor output in order to achieve a smooth driver torque demand.
0 = Filtering OFF
99 = Max Filtering
= Important Note:
It is strongly recommended to span the table axis as follows:
X - Axis = Rate of Pedal Position sensor change
Y - Axis = Pedal Position Sensor
Example
Using dPedal Position Sensor 1 and Pedal Position Sensor 1, the Throttle Area Demand can be softened at low dPedal rates whilst also giving the ability to change the filtering based on the raw pedal position.
Reviewing PC/ECU logs will allow the user to achieve the desired effect.
Top Plot (white trace) shows Throttle Area Demand
Bottom Plot shows the Pedal Position Sensor (green trace) vs Pedal Position Demand (white trace)
Driver Demand Torque Correction Table
Driver Demand Torque Correction Table
Driver Demand Torque is calculated based on various parameters in the ECU along with driver controlled pedal inputs.
If however there are correlation errors between the actual Engine Torque and Driver Demand torque, these can be trimmed using this table.
The range is 0.000 to 2.000. A value of 1.000 being equivalent to the calculated torque demand without correction. As with the Engine torque correction table the default table is produced using only the the X axis as an example. However both the X & Y axis are available and can be enabled at any time in the axis setup form.
Note: The Driver Demand Torque is calculated fully Independent to the Engine Torque, so there will always be a small error between the two. A normal and acceptable error is around 10%. For example Driver Demand Torque might be 470Nm and Engine Torque 490Nm. This is an acceptable error & not unusual.
DBW Torque Management
Introduction
The ECU uses a torque based system for DBW throttle plate control, which means all torque requests are done using Throttle Area, not Throttle Position.
There is no direct DBW Servo Position “Target” table, but instead a Throttle Area Demand table (more information below). So the throttle area directly relates to the engine torque which is why this function is under Torque Management.
For Engine torque calculations and during Torque limiting events the ECU converts the engines throttle area into engine airflow (g/s), then into engine torque (Nm) using mathematical models. This model allows the ECU to use this calculation in either direction:
Throttle Area -> Airflow -> Engine Torque. Starting with throttle area the ECU can calculate the engine torque.
Torque Target -> Airflow -> Throttle Area Target. Starting with a torque Target, the ECU can target a throttle plate area to achieve that torque.
Throttle Area data is available either in the Runtime menu(F3) -> Torque or DBW 1/2 tab. The “Throttle Area Demand Status” indicates the current throttle area in use.
How does the ECU then convert throttle area to DBW servo position target?
This is done using the “Throttle Body Area Table " which translates Throttle Area into Servo Position. The ECU uses this as a lookup table, converting any requested Throttle Area into a Servo Position target for the DBW system. See the Throttle Body Area help topic for more information.
The process of converting Pedal Position -> Throttle Area Demand -> DBW Servo Target
To understand the process of converting Pedal Position into Throttle Area, carefully read this section.
Note the Throttle Cranking Area table. This ONLY gets applied during cranking and overrides any pedal request. See Cranking Throttle Area Demand
The Pedal Position Sensor goes through a pedal position filter table to give you Pedal Position Demand . This will help smooth out signal fluctuations and improve the driving experience. Press H to read the help below the table. So this step is Pedal Position Sensor -> Pedal Position Demand

**Tuning Tip**: To avoid large input delays from the Pedal Position Sensor the filter setting on the raw input should be keep small . i.e the input filtering is done during the **Pedal Position Sensor -> Pedal Position Demand** so minimal filtering is required on the raw Pedal Position Sensor Input (See Config View -> Channels -> Inputs Setup -> DBW/Servo Tab). A Typical value will be between 0 - 4.
The new Pedal Position Demand should be used to span the Pedal to Throttle Area Demand Translation Table 1. This demands a Throttle Area (not a position). This table controls the “feel”, making the engine feel more responsive or less responsive by controlling the Torque demand through Throttle Area.
So this step is Pedal Position Demand ->Throttle Area Demand
In this last step the ECU will convert the Throttle Area Demand into the Servo Position Target for the DBW function. This is when the ECU uses the “Throttle Body Area” table mentioned at the start of this section. The ECU uses this as a “lookup” table to convert the Throttle Area Demand into a DBW Servo Position Target.
So this final step is Throttle Area Demand -> DBW Servo Position Target
Torque information transmitted over the CAN bus can be modified using two separate tables: one for Engine Torque and one for Driver Demand Torque.
These tables allow the transmitted torque values to be modified to alter how other vehicle systems respond to the torque information, such as traction control, transmission, and other torque-dependent systems.
This can change the behavior of the Gearshift along with clutch pressure in gear. If there is excessive slip typically the Torque reported should be increased. If the gearshift feel is too sharp and aggressive the Torque reported should be reduced.
The table(s) apply an Nm offset.
Table range is +/- 1000.0 Nm
Example: Gearbox
The above example shows a typical setting.
The increase in Torque reported over the CAN bus will have the effect of sharpening the transmission shifting and clutch lockup.
NOTE: It is important to note that directly programming the TCM through a third party flashing tool is advised over using the ECU to offset the torque reported.
TCM Throttle Torque Gain
TCM Throttle Torque Gain
Torque Limit Strategies
Torque Reduction Strategy Priority
The ECU provides five Torque Reduction Strategy (Strat Modes). Each Strat Mode has three configurable priority levels that define the preferred order in which the available torque reduction methods are used.
Functions throughout the ECU that request torque reduction can select which Strat Mode to use. For example, Launch Control and Traction Control can each be configured to use a specific Strat Mode.
Each Torque Reduction Strategy (Strat Mode) can use a combination of three torque reduction methods:
Priority
Torque Reduction Method
0
Throttle Area
1
Ignition Retard
2
Fuel / Ignition Cutting
Three priority levels are available to determine the preferred order in which these methods are used to achieve the requested torque target.
The highest priority method is always used first. If it cannot achieve the requested torque target, the ECU will use the next priority method. This can occur when the selected method reaches a configured clamp or when the required change in throttle air mass takes time to occur. (ie Priority 2 can help reduce torque until Priority 1 method reaches its target)
This priority system is particularly useful during long or sustained Torque Limit conditions, allowing the ECU to use the preferred torque reduction method while automatically using additional methods when required.
Example:
The following priority is configured:
Priority 1: Throttle Area
Priority 2: Ignition Retard
Priority 3: Fuel / Ignition Cutting
Ignition Retard Maximum Clamp: 15°
When the Torque Limit becomes active, the ECU begins transitioning the Throttle Area towards the position calculated to achieve the requested torque target.
During this transition, the throttle air mass does not change instantaneously, so the requested torque target may not initially be achieved. The ECU therefore uses Priority 2 and applies the calculated Ignition Retard required to achieve the torque target.
If the torque target is still not achieved and the Ignition Retard reaches the configured 15° maximum clamp, the ECU moves to Priority 3 and applies Fuel / Ignition Cutting to complete the required torque reduction.
As the throttle area continues to transition and provides sufficient torque reduction, the ECU progressively removes the Ignition Retard. Once the throttle area can independently sustain the requested torque target, no additional torque reduction method is required.
This allows the ECU to use the preferred torque reduction method whenever possible while automatically applying additional methods when required to achieve the requested torque target.
Strat Mode Torque Reduction Clamps
Each torque reduction method has a configurable clamp that limits the maximum amount of reduction that method can provide. If the requested torque target cannot be achieved and the configured clamp is reached, the ECU moves to the next priority level.
Throttle Area – The Throttle Area Minimum Clamp Table defines the minimum throttle area that can be requested. If the requested torque target cannot be achieved and the minimum throttle area is reached, the ECU moves to the next priority.
Ignition Retard – The Ignition Retard Maximum Clamp Table defines the maximum amount of ignition retard that can be applied. If the requested torque target cannot be achieved and the maximum retard is reached, the ECU moves to the next priority.
Fuel / Ignition Cutting – The Engine Cut Maximum Clamp Table defines the maximum amount of engine cut that can be applied. If the requested torque target cannot be achieved and the maximum cut is reached, the ECU moves to the next priority.
Torque Limit Gain Tables
Torque Limit Ignition Retard Gain Table
This table calibrates the torque reduction % per degree. When a torque request is applied the ECU will calculate how much retard is required to achieve this torque request.
Example : 1.5%/ Deg.
The Engine is running at 600Nm and a Torque Reduction to 400Nm is requested.
This is a 33% reduction in Torque so at 1.5%/Deg the ECU will Retard the Ignition 22 Degrees.
(33% / 1.5%/deg = 22 Deg)
Example : 16 degrees of ignition trims (Ignition Trims Total) are being applied - for any reason (comps, secondary load, etc)
The ECU will calculate 20% of torque reduction - can be observed with Runtime “Torque Reduction - Retard (Nm)”
See default table settings below.
Torque Reduction Ignition Retard Gain Table
Torque Limit Cut Gain Table
This table calibrates the torque reduction % per %cut. When a torque request is applied the ECU will calculate how much cut is required to achieve this torque request.
See default table settings below.
Torque Reduction Cut Gain Table
Torque Limit Boost Target Margin Table
During Torque Limiting the ECU calculates (when enabled) the Minimum Boost Target required for the engine to achieve this Torque. The engine actually needs more than this minimum for the Throttle Mass Limiting to be effective so the " Boost Target Margin" is added to this value.
Example: ECU calculates a Boost Target of 150 kPa. If Boost Target Margin is 20kPa, the final Boost Target during Throttle Mass Flow Limiting will be 170kPa
User Torque Limits
In addition to Motorsport and special features included in the firmware that utilize Torque Management (Launch Control, Traction Control, Engine Speed limiting), there are 5 User Configurable Torque Limits.
User Torque Limits 1-5
User Torque Limit Function Setup
The User Torque Limits must be enabled in the Function Output Setup
Furthermore, a Custom Label can be assigned to the function