Before looking at the Torque data available in the ECU, it is important to understand why Torque is such a fundamental parameter within the ECU.
The majority of the ECU functionality operates on Torque, specifically through Torque Reduction. Instead of simply applying a fixed amount of throttle closure, ignition retard or engine cut, functions such as Traction Control and Launch Control can request a specific amount of torque reduction. The ECU then uses the configured Torque Reduction Strategies (Strat Modes) to calculate how to achieve the requested reduction. These strategies are user configurable and use three primary methods to reduce torque:
Throttle (TMF): Using the TMF Air Mass Model the ECU can calculate the throttle area required to achieve the requested torque reduction.
Ignition Retard: Using the Ignition Retard Scaling Table, the ECU calculates the amount of ignition retard required to achieve the requested torque reduction.
Engine Cut: Using the Cut Gain Table, the ECU calculates the amount of engine cut required to achieve the requested torque reduction.
: The ECU uses the calculations within the Engine Torque Model to precisely determine the throttle area, ignition retard or engine cut percentage required to achieve the requested torque target. The required value is calculated directly and applied instantly, rather than using a slow closed-loop process to progressively adjust the torque reduction.
: Importance of Accurate Torque Modelling
Because torque-based control functions rely on the calculated engine torque, the accuracy of the Engine Torque Model is critical. If the calculated torque does not accurately represent the actual engine torque, a requested torque reduction may not produce the expected change in engine output. This can result in torque control functions being either too aggressive or insufficient. The Air Mass Model is a primary input to the Engine Torque Model. Accurate calibration of the Air Mass Model is therefore essential for accurate torque calculation and reliable torque control.
The engine torque produced by combustion is calculated by the ECU using modelled algorithms and is referred to as Ideal Engine Torque. The moving parts inside the engine assembly create drag and therefore limit the torque available at the crankshaft. The estimated torque required to overcome this drag is called Frictional Loss.
The ECU also produces a calculation for Driver Demand Torque using a weighted mathematical model from multiple inputs. This is explained further down the page.
Important Note:
The Engine Torque and Driver Demand Torque calculations have no direct correlation and are calculated independently. Under normal operating conditions, both calculations will generally converge and track closely. The accuracy of both calculations depends on the accuracy of the engine setup and calibration, including Injector Data, Fuel Density, Air Mass Model, and other relevant parameters. The ECU calculates torque in Newton-metres (Nm).
The Engine Torque andDriver Demand Torque data can also be transmitted over the CAN bus for some OEM applications. Accurate torque modelling is therefore particularly important when responding to transmission torque reduction requests, where the transmission relies on accurate torque information and controlled torque reduction.
Engine Torque (Nm)
The primary input used to calculate Engine Torque is the Final Air Mass (g/s) entering the engine. The Final Air Mass will be heavily influenced by the Air Mass Model, the VE table and Injector charachterisation so this data must be as accurate as possible to ensure the accuracy of the Engine Torque calculation.
Ideal Engine Torque is calculated using the following inputs:
Final Air Mass (g/s)
Throttle Area
Lambda Target
Stoichiometric Ratio
Number of Cylinders
Compression Ratio
Compression Ratio: For a given Final Air Mass and Lambda Target, an engine with a higher Compression Ratio will generally produce more torque than an otherwise equivalent engine with a lower Compression Ratio. This is because the higher compression ratio allows the combustion process to convert a greater proportion of the available energy into useful mechanical work. The ECU applies an internal Compression Ratio Correction to account for this effect.
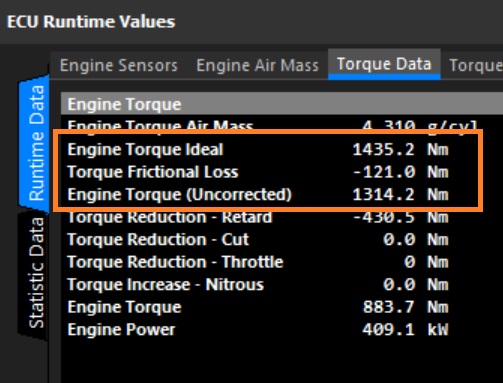
Uncorrected Engine Torque is calculated by accounting for the frictional loss of the engine. It is named “uncorrected” because other inputs can further change the Engine Torque. An Engine Torque Correction factor can also be applied and is described further down the page.
Final Engine Torque accounts for the additional inputs that can reduce or increase Engine Torque such as:
Engine Cutting (Reduce Engine Torque)
Ignition Retard (The Torque Model assumes the engine has the Ignition tuned for peak torque, so any retard will therefore reduce Engine Torque)
Throttle (Throttle Mass Flow function(s) can close the throttle plate, reducing the Air Mass and hence Engine Torque. For example VDC control)
Nitrous (This will increase Engine Torque)
Driver Demand Torque (Nm)
The Driver Demand Torque is the torque requested by the driver, primarily as a function of engine speed and pedal position to give a requested throttle area. We know through mathematical modeling that from throttle area we can calculate airflow and from airflow we can calculate torque.
Apart from some specific exceptions, the engine torque must be controlled by the driver. Some exceptions include: downshifts, traction control (VDC event), pit lane speed limiter and cruise control.
The driver only has control of torque by using the pedal, but other factors get included into the mathematical model to give a final Driver Demand Torque. These include:
Engine Speed
Throttle Area and Diameter
Engine VE
Charge Temperature
Peak Manifold Pressure (Used as peak load indicator). See Torque -> Drive Demand Torque -> Peak Manifold Pressure Estimate.
Lambda Target
Number of cylinders
Compression Ratio
All those parameters get included in a complex mathematical model which generates a runtime called Driver Demand Torque Ideal.
Accounting for frictional loss of the engine the final Driver Demand Torque can be expressed as:
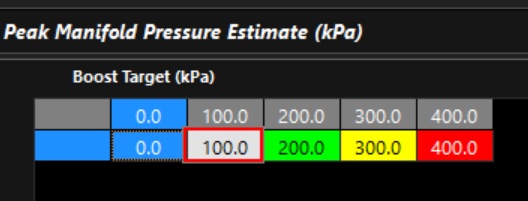
This is a critical parameter used in the Driver Demand calculation. The ECU compares the current Manifold Pressure against the expected peak value to determine a pressure ratio. This ratio is then used as a weighted scaler within the mathematical model to derive Driver Demand Torque.
Think of this value as a load indicator — it represents how close the engine is to its expected maximum manifold pressure.
The table can normally use 1:1 scaling, with the axis spanning the expected pressure range:
For a normally aspirated engine this is barometric pressure.
For a turbo charged engine this is normally the boost target.
Torque Runtime Data
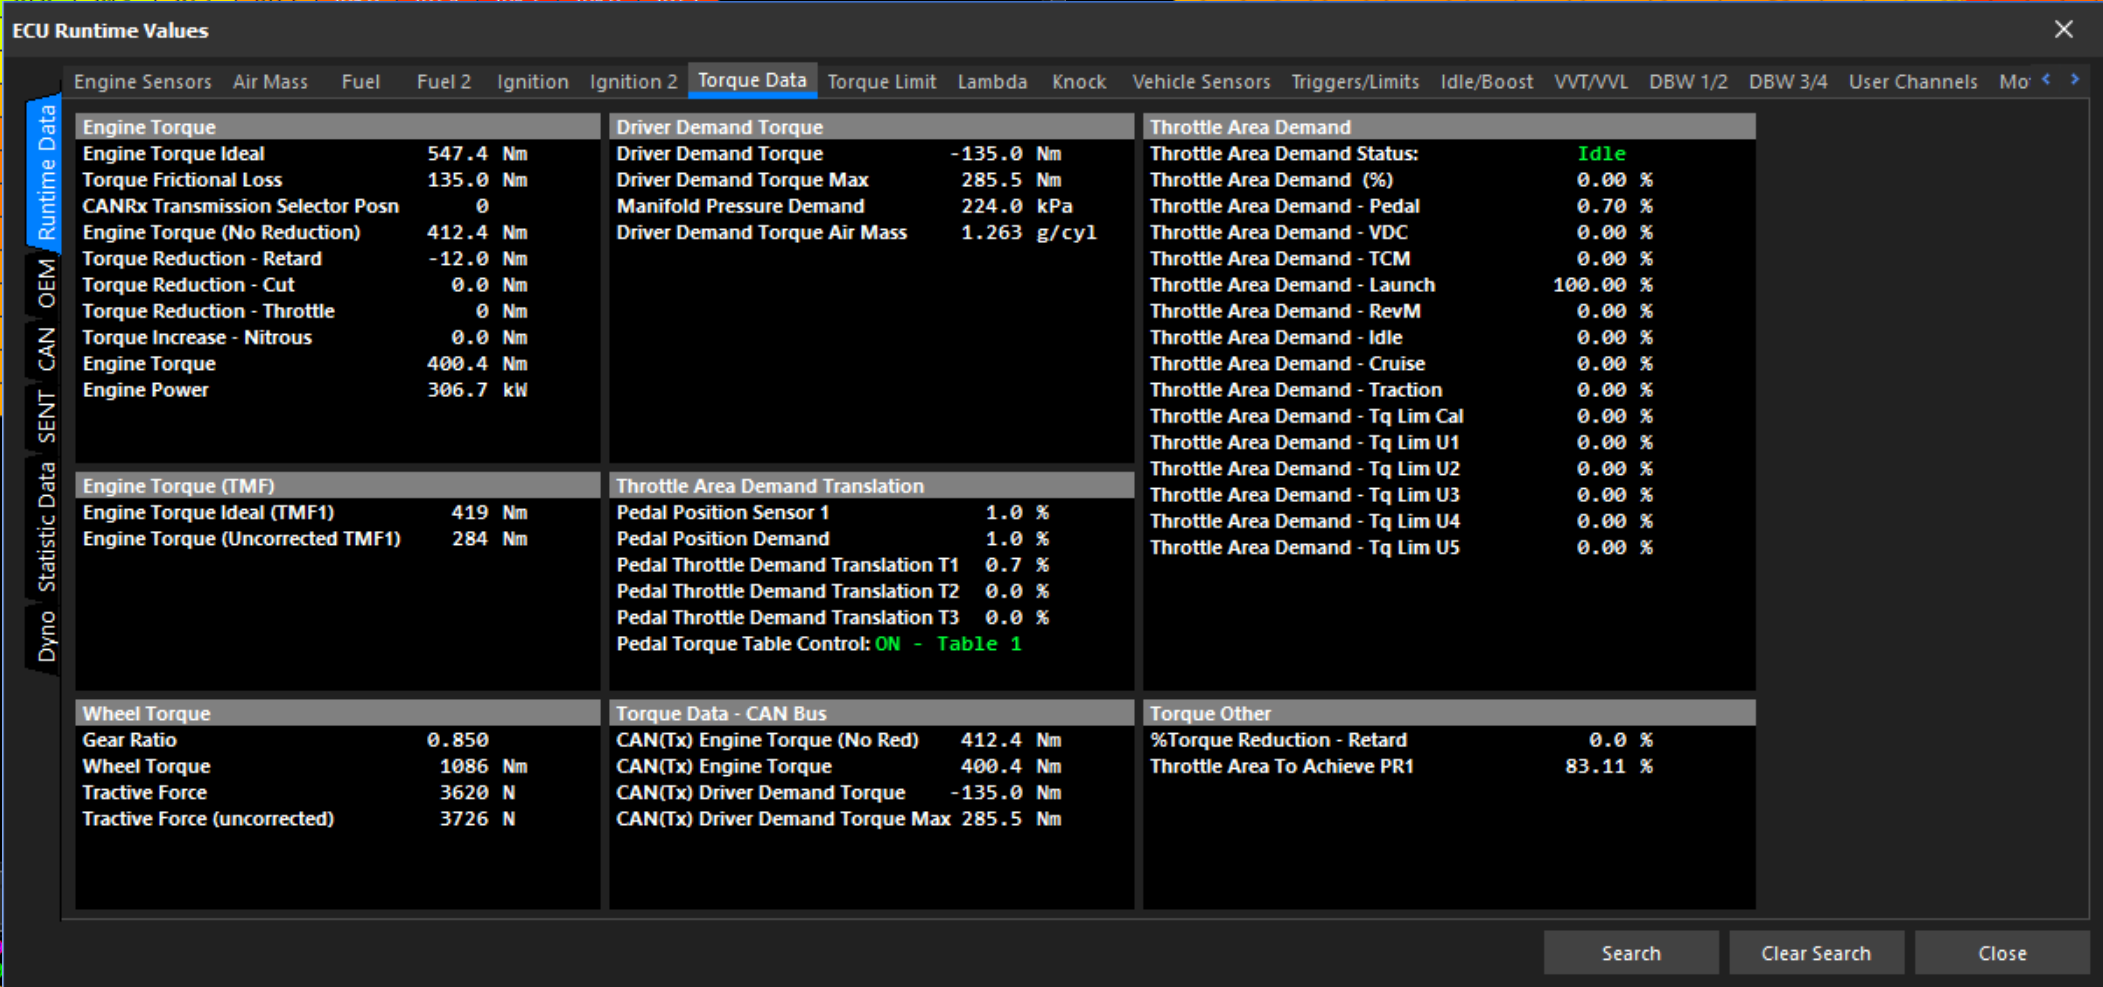
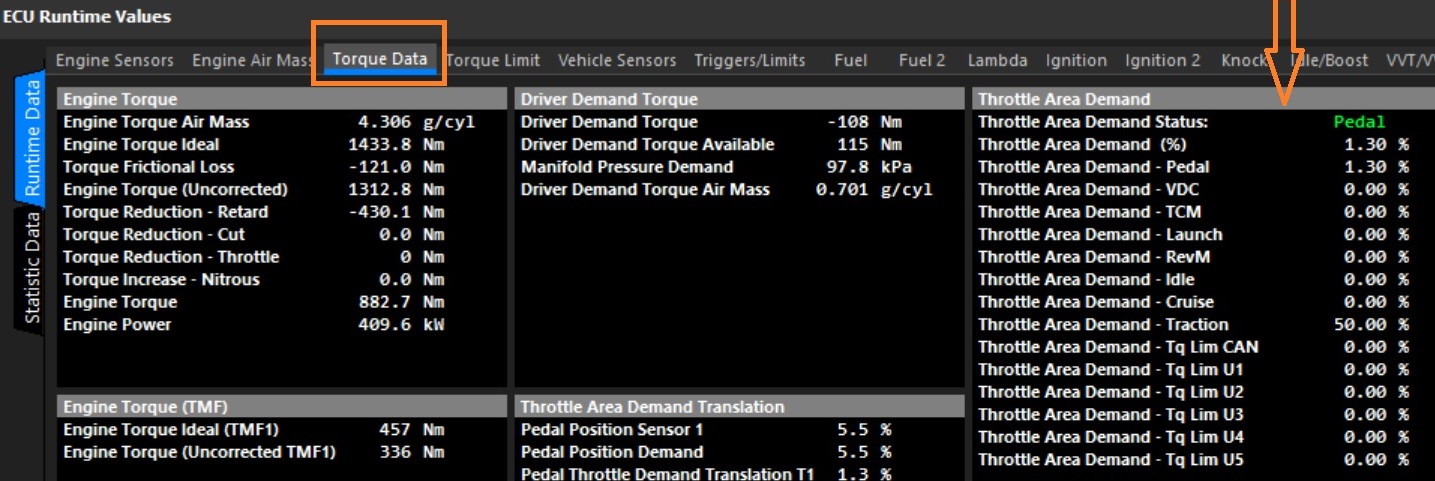
Engine Torque and Driver Demand Torque data is available in the Runtime Values(F3) > Torque Data tab.
Firstly, the Engine Torque values must be validated on a dyno to ensure the ECU Torque Calculation (Engine Torque Ideal, Engine Torque), are close to the values being produced on the dyno.
Note: If using a dyno where wheel power is reducing values, then this error must be factored in.
A properly tuned engine, with no error in the basic air mass model is the first step. Having proper injector data, engine displacement, fuel type/stoich, and a tuned VE table will already calculate accurate engine torque.
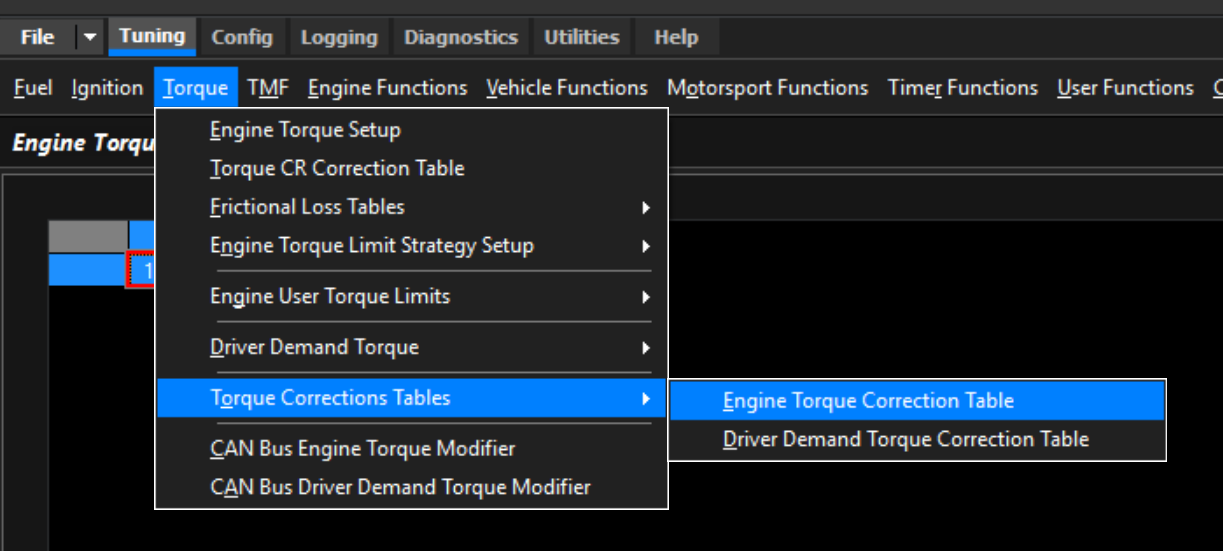
Engine Torque Correction Table
If engine torque is not calculating accurately, you can correct the torque calculation via the Engine Torque Correction Table.
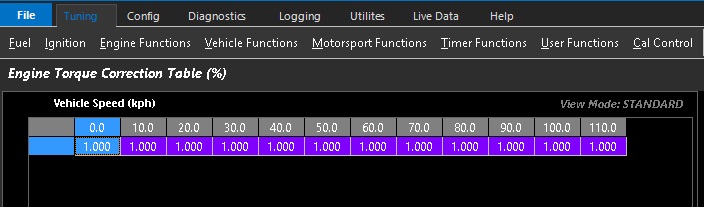
Tip: A value of 1.0 = no correction.
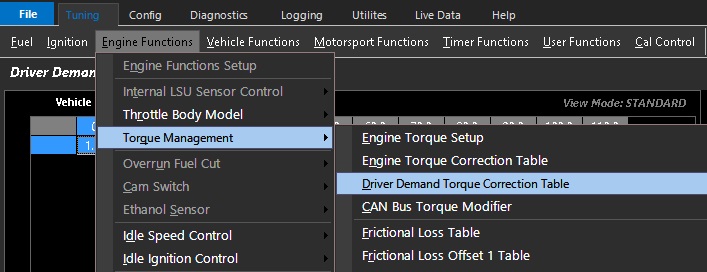
Driver Demand Torque Correction Table
Driver Demand channel is used in some OEM applications, but also can be used as a channel in the ECU to feed forward the driver tour requests. The Driver Demand can be corrected via the Driver Demand Torque Correction Table.
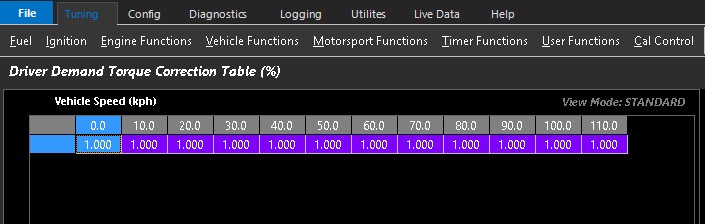
Tip: A value of 1.0 = no correction.
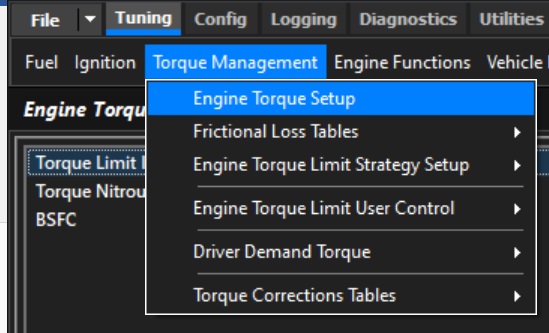
Torque Management Setup
Overview
Please refer to Torque Modelling for more information on how the ECU generates Engine Torque and Driver Demand Torque data.
For Torque Tuning information please refer to Torque Tuning
Torque Reduction Ignition Retard Clamp
This clamp value sets the maximum amount of ignition timing retard the ECU is able to apply during a torque reduction event.
Typical value is 40.0 degrees of retard.
: WARNING: An insufficient clamp value may prevent the ECU from achieving the requested torque reduction, resulting in a failed torque reduction event.
Torque Nitrous Gain
When Nitrous is used to increase engine torque, the ECU automatically calculates the resulting additional Air Mass introduced by the Nitrous system.
In some applications, the calculated torque increase may require a small amount of scaling to account for differences between the modelled and actual engine response. The Torque Nitrous Gain setting can be used to trim the calculated torque increase and improve the accuracy of the Engine Torque Model.
Default Value = 1.00 ( No Scaling)
For example: Torque Increase-Nitrous = 100 Nm
Torque Nitrous Scaler = 1.25
“Torque Increase-Nitrous” final value after scaling 125Nm
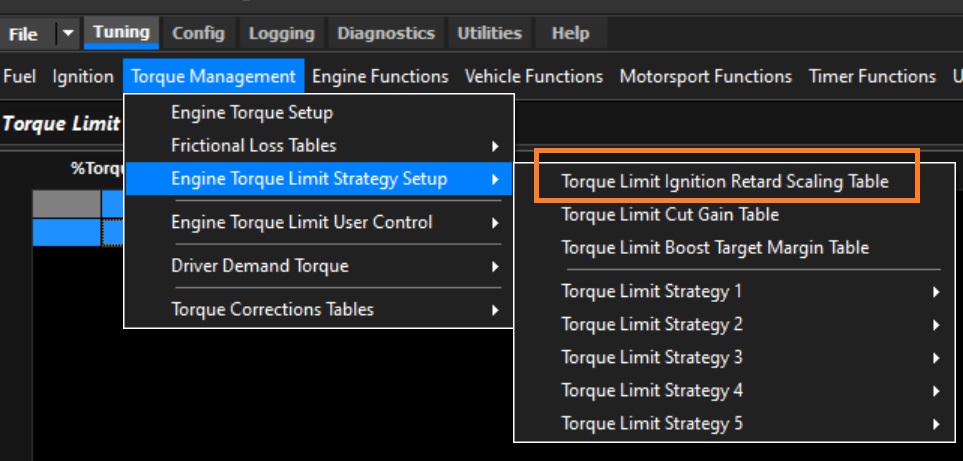
Torque Limit - Ignition Retard Scaling Table
During a Torque Reduction Request, the ECU can reduce engine torque by retarding the ignition timing from the **MBT (Minimum spark advance for Best Torque) ignition angle.
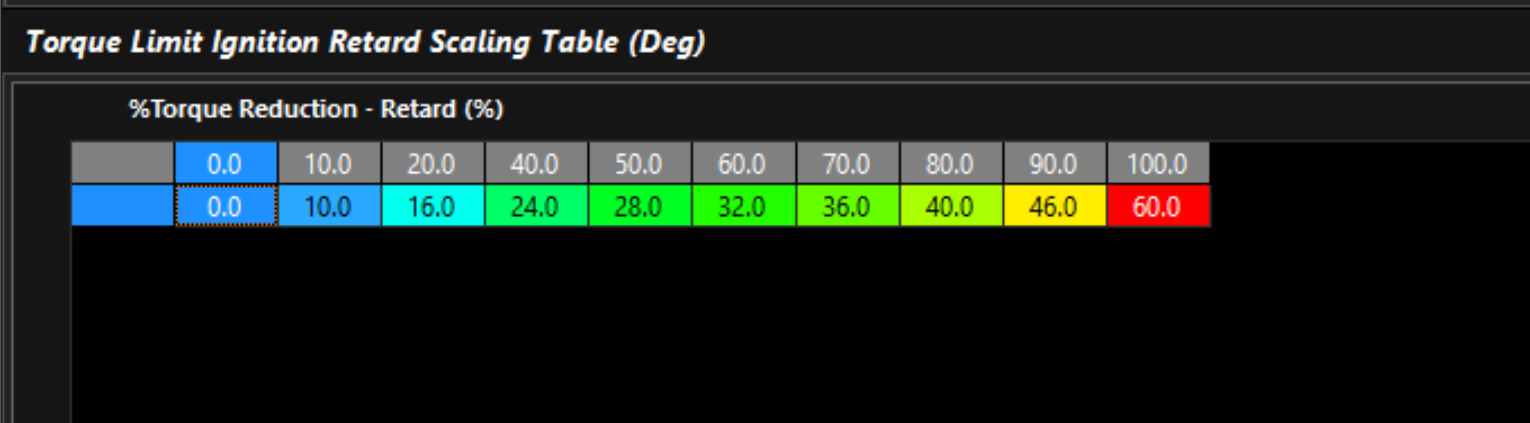
To achieve the requested torque reduction, the ECU needs to understand the relationship between the percentage of torque reduction and the required Ignition Retard. The Torque Limit - Ignition Retard Scaling Table defines this relationship.
The X-axis represents the requested Torque Reduction (%), and the table value represents the corresponding Ignition Retard (°) required to achieve that level of torque reduction. The default values are suitable for most applications.
Example: The engine is producing 600 Nm and a Torque Reduction to 420 Nm is requested.
This represents a 30% reduction in torque, 600 Nm → 420 Nm = 30% Torque Reduction.
Interpolating the table at 30% Torque Reduction determines that approximately 20° of Ignition Retard is required to achieve the requested torque reduction.
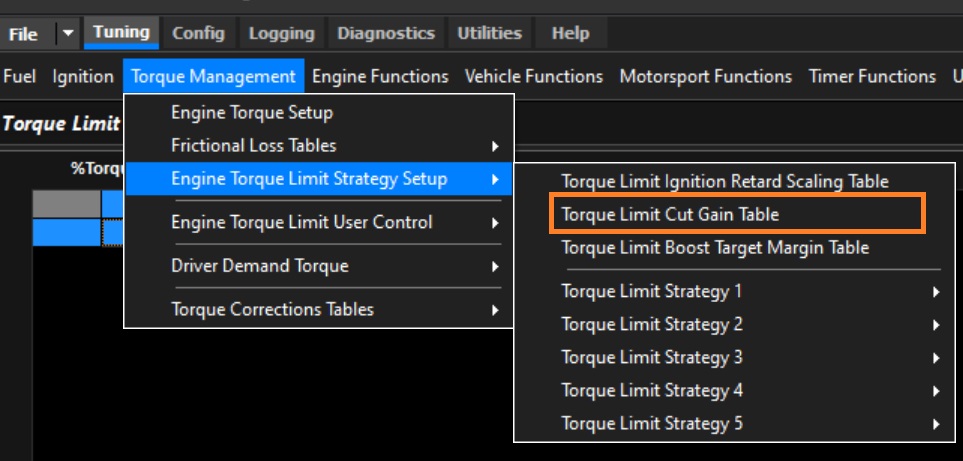
Torque Limit - Cut Gain Table
During a Torque Reduction Request, the ECU can reduce engine torque by applying Engine Cut.
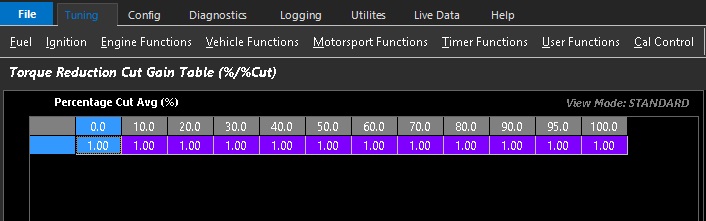
This setting defines the relationship between Engine Cut (%) and the resulting Torque Reduction (%). The table value represents the percentage of Torque Reduction achieved for every 1% of Engine Cut.
Example: The engine is producing 600 Nm and a Torque Reduction to 420 Nm is requested.
Engine Torque at 600Nm.
Requested Torque Reduction = 180 Nm
Requested Torque Reduction = 30%
1.0 %/ %Cut. ECU will cut engine at 30%
0.8 %/ %Cut. ECU will cut engine at 37.5%
1.2 %/ %Cut. ECU will cut engine at 25%
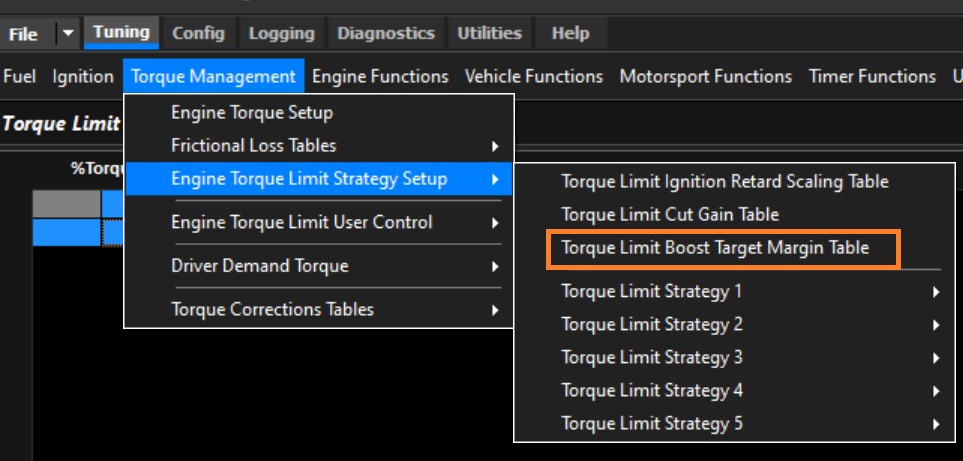
Torque Limit - Boost Target Margin Table
During Throttle Mass Flow Limiting, the ECU calculates the Minimum Boost Target required for the engine to achieve the requested torque.
The boost pressure must be higher than this minimum for Throttle Mass Flow Limiting to operate effectively. The Boost Target Margin is therefore added to the calculated Minimum Boost Target to provide the required headroom.
Example:* The ECU calculates a Minimum Boost Target of 150 kPa. If the Boost Target Margin is set to 20 kPa, the final Boost Target during Throttle Mass Flow Limiting will be:
150 kPa + 20 kPa = 170 kPa
Torque Limit - Target Calibrate
Use to Calibrate the Torque Limt Function. Use this function with CAUTION.
Enter a Torque Limit value to calibrate the system. This setting ALWAYS gets cleared at power-up
This will Override the CAN Torque Limit Request data, use the F3 Runtime menu to view data,
-1000.0 Nm = OFF
Torque Limit - Strat Calibrate
Used by the Torque Limit - Target Calibrate setting to determine which Torque Reduction Strategy (Strat Mode) is used to apply the requested torque reduction.
(If a value out this range is ued, the function will not operate)
0 = OFF
1 = Strat Mode 1
2 = Strat Mode 2
3 = Strat Mode 3
4 = Strat Mode 4
5 = Strat Mode 5
Engine Torque Correction
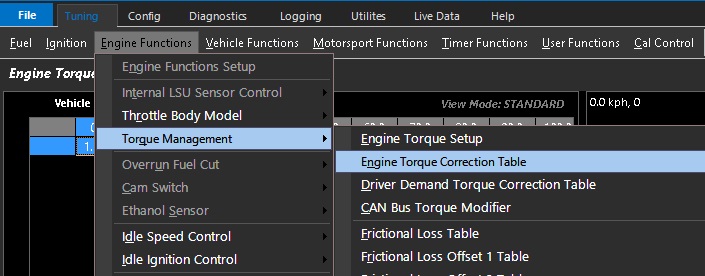
Engine Torque Correction Table
The ECU accurately calculates the Engine Torque, however if any calibration errors lead to incorrect readings, this table allows the user to adjust the gain based on any parameter listed in the axis setup form.
The range is 0.000 to 2.000, a value of 1.000 being equivalent to the calculated torque demand without correction. The default table is produced using only the X axis as an example. The Y axis is available and can be enabled at any time in the axis setup form.
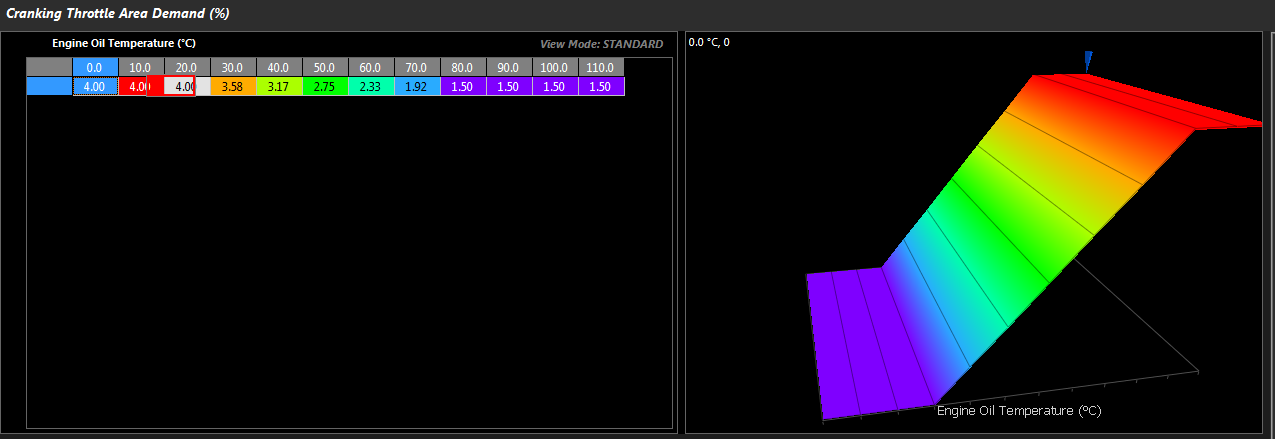
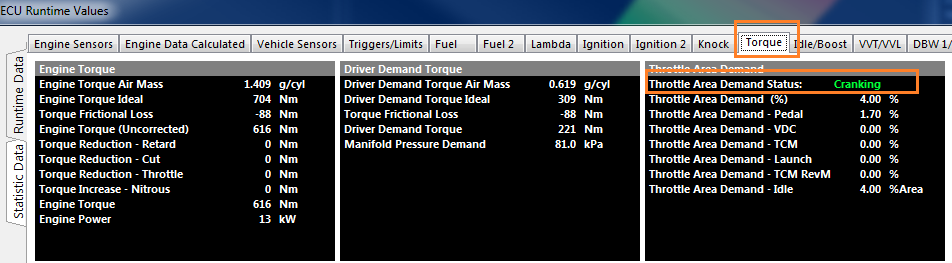
During engine cranking (Engine Speed < Crank Exit RPM setting) this table is used to generate a Throttle Area Demand ,overriding any request from the pedal. The ECU then uses the Throttle Body Area table to convert Throttle Area into the DBW Servo Position target.
See the DBW Torque Management help topic for more information on the process of converting Pedal Position to Throttle Area to DBW Servo target.
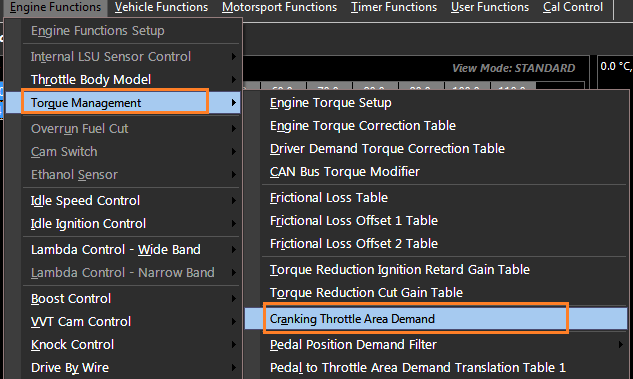
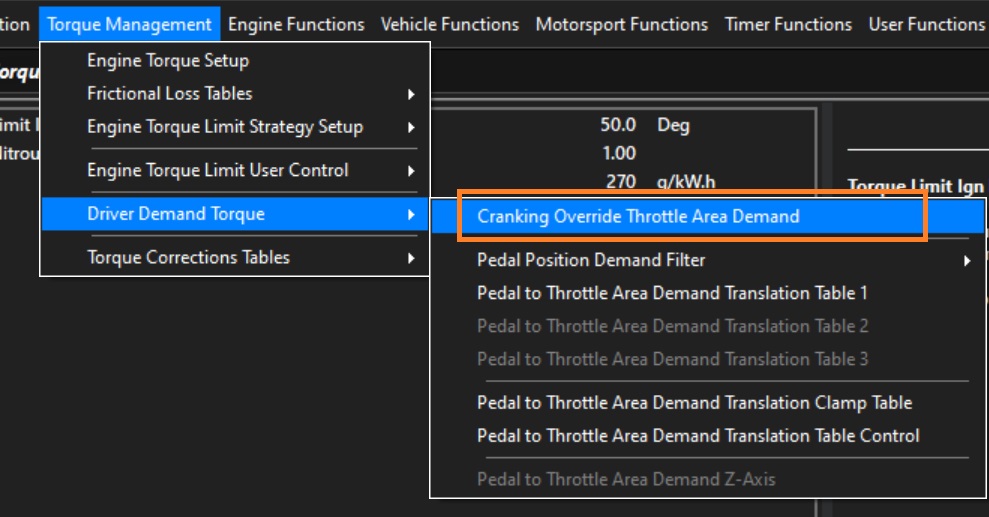
This table is available from the Engine Functions -> Torque Management -> Cranking Throttle Area Demand menu.
Cranking Throttle Area Demand data
This is available from the runtime (F3) menu , Torque or DBW 1/2 tab.
Frictional Loss Tables
Overview
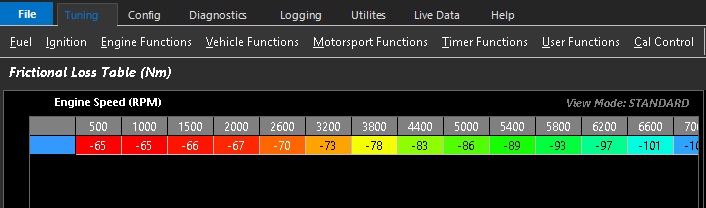
The engine torque produced by combustion is calculated by the ECU and referred to as “Ideal” Engine Torque. The moving parts within the engine have mass and are subject to frictional losses and therefore limit the actual torque available. As such, the estimate of torque required to overcome this drag effect is called Frictional Loss. This estimate is found in the Frictional Loss Table in units of Nm. A default table is provided as a guide to be adjusted (See below)
Frictional loss is instrumental in torque management tuning. If any function in the ECU requires torque targeting, feeding error here will cause the system to not function correctly.
These internal torque losses are mainly influenced by the cylinder count i.e. the more cylinders you have, the more moving parts and therefore more friction & the more parasitic loss of torque.
Calibrating Frictional Loss
The engine must be fully mapped and calibrated before editing the Frictional Loss table.
Tuning Tip:
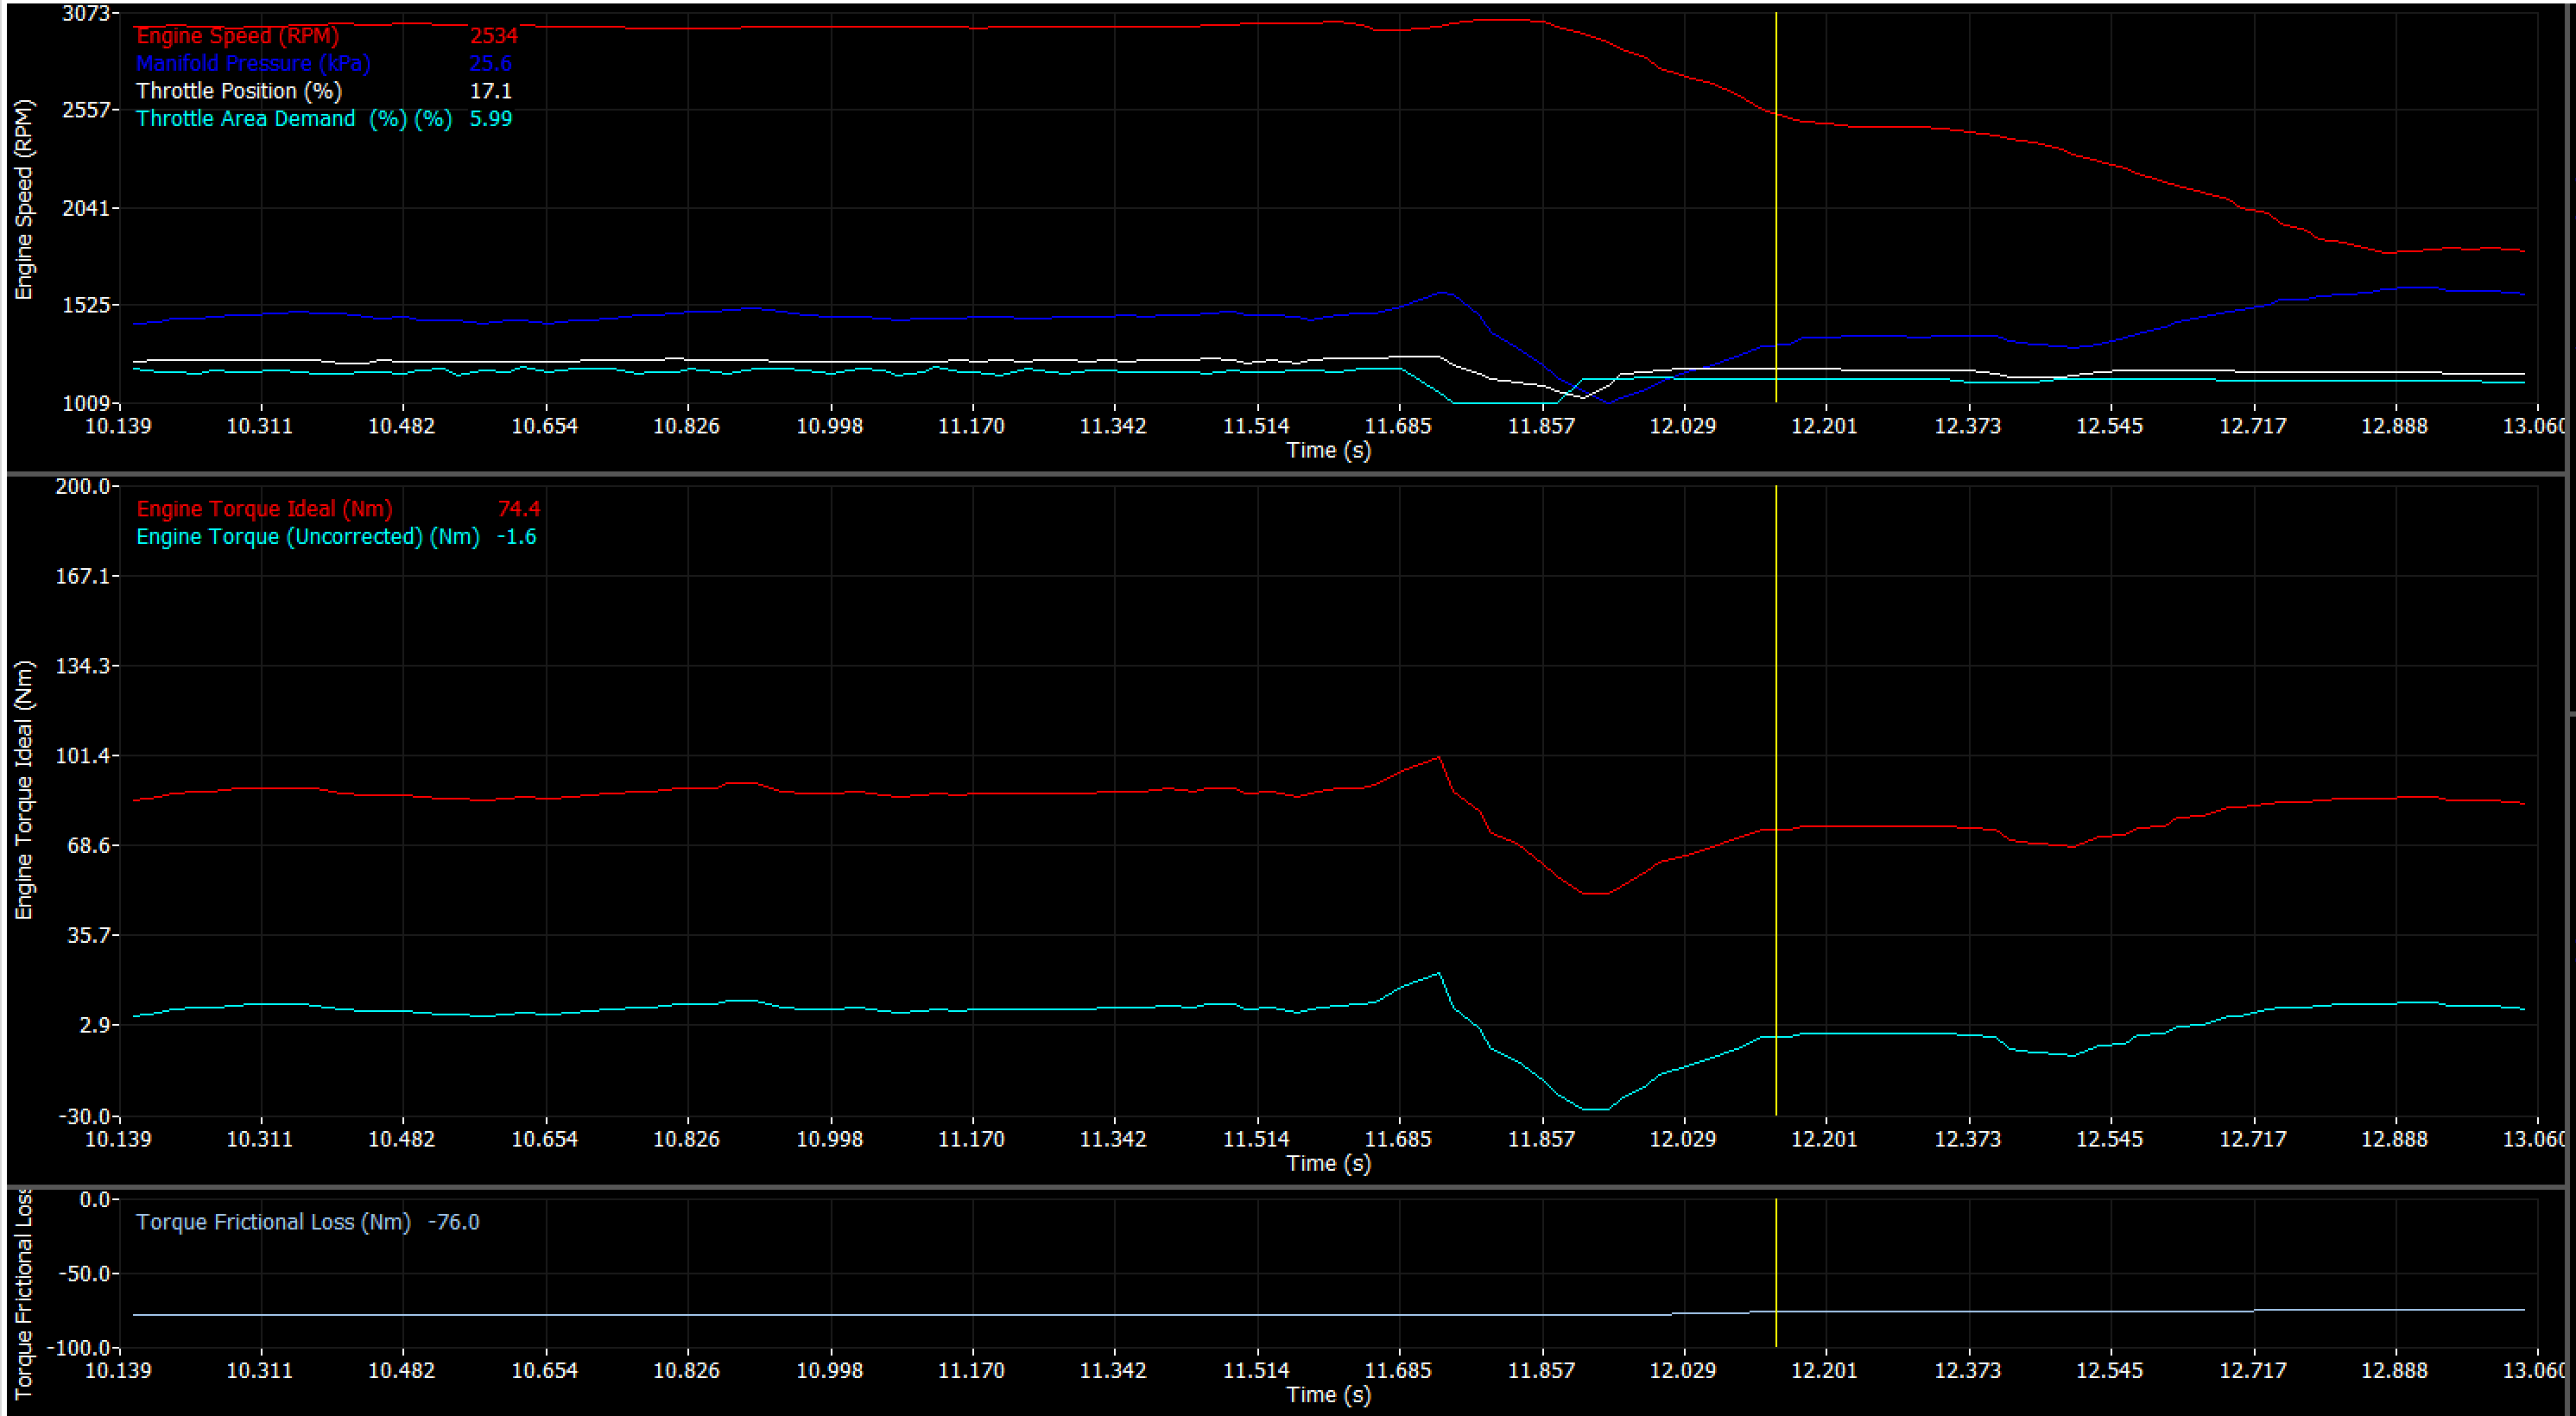
A simple way to obtain a close representation of engine friction is to run the engine in neutral, with no external load on the engine, and adjust the Frictional Loss value at each RPM point until Engine Torque (Uncorrected) is approximately 0 Nm. This represents a condition where the engine is neither accelerating nor decelerating.
i.e. Vary the engine speed in neutral and adjust the Frictional Loss table at each RPM point until Engine Torque (Uncorrected) = 0 Nm.
All the Torque Data can be viewed from the Runtime menu (F3), Torque Data tab.
This procedure teaches the ECU how much Ideal Torque is required to achieve different engine speeds. This is instrumental in RPM targeting functions used to achieve or maintain a specific RPM, such as RPM Limiting, Launch Limiting, and other RPM control functions.
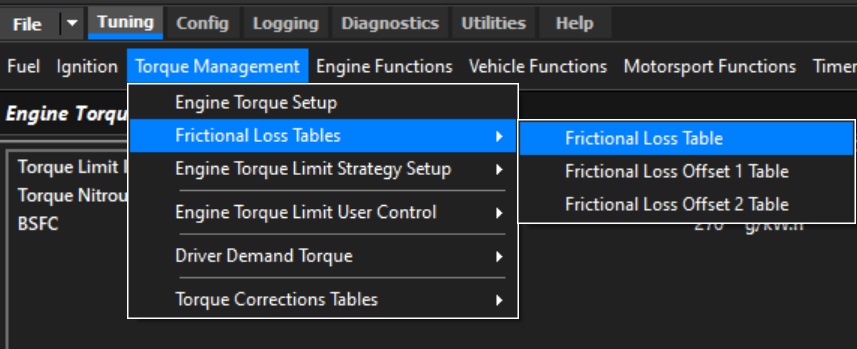
Tuning -> Engine Functions -> Torque -> Frictional Loss Table
Frictional Loss Offset Tables
There are two tables that allow offsetting of the frictional loss. One typical example will be adjusting the loss based on oil temperature.
Important Notes:
Engine temperature, oil temperature, and other factors can significantly affect frictional losses. Two offset tables are available to compensate for these factors.
Errors in the Air Mass Model or basic engine setup will cause the calculated base torque values to be incorrect. Before tuning the torque model, ensure there is no significant difference between Lambda Target and Actual Lambda. This provides a useful validation that the Air Mass Model is correctly calculating engine airflow.
Pedal to Throttle Area Demand Translation
Introduction
As discussed at the beginning of this section DBW Torque Management the ECUs Torque Management using DBW requires the plate control to be in Throttle Area, not Throttle position.
Pedal to Throttle Area Demand Translation Tables
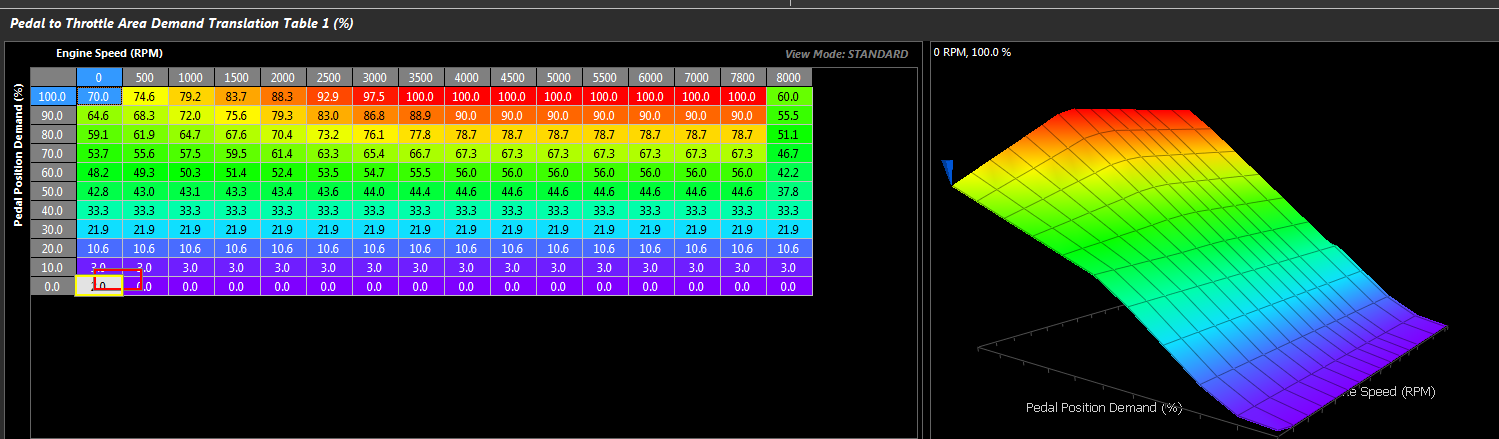
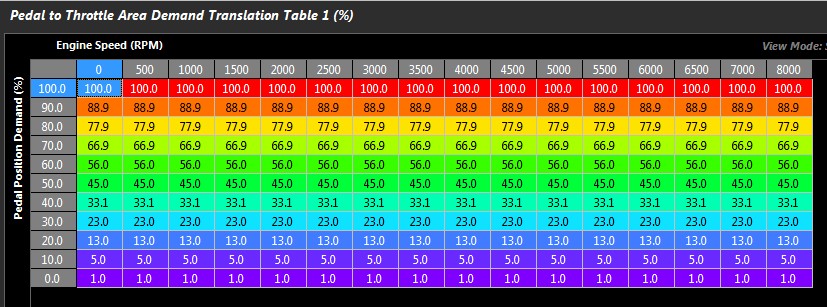
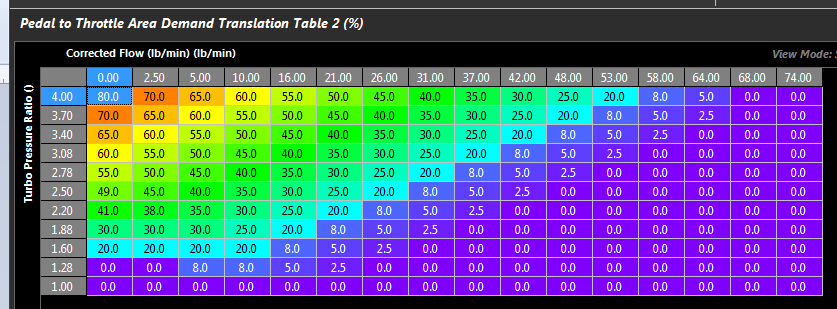
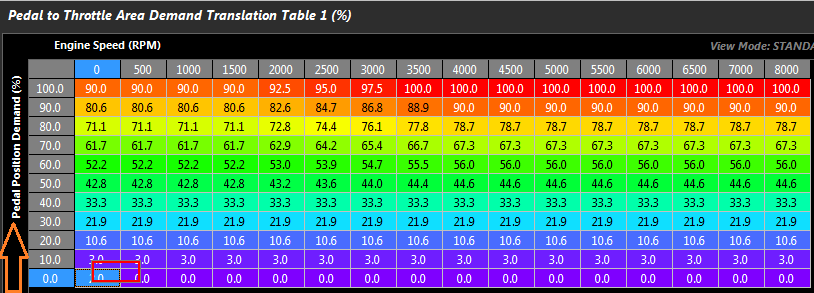
Pedal to Throttle Area Demand translation is performed using a 3D table. Three tables are available, only 1 can be active at any one time.
NOTE: This table targets Throttle Area (NOT DBW Servo Position)
The relationship of Servo Position should be ignored with a properly tuned Throttle Body Area system in the Throttle Body Model. Torque targeting should be the overall mentality of this map, and while with everything configure as it should (TMF, etc), linearized table may produce linearized Driver Demand, this may not be ideal for how the vehicle will want to drive. More often than not the demand table will end up in a shape where the higher end of the table (60+) has much larger values in it - to demand more torque.
The Y-Axis runtime should be spanned using “Pedal Position Demand” which is a filtered version of the raw Pedal Position sensor. See Pedal Position Demand Filter
A typical runtime for the X-Axis is Engine Speed.
Pedal to Throttle Area Demand Translation table
Pedal to Throttle Demand Translation Clamp Table
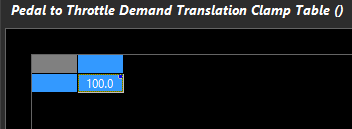
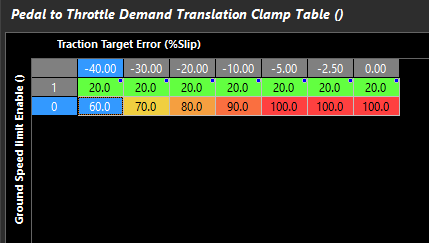
This is a 3D table that clamps the maximum allowable throttle area. If no clamping of the Throttle Demand is needed, a single value of 100% can be used.
Two examples are shown below.
Basic Throttle Area clamp table (no Throttle Demand Clamping is needed)
Advanced clamp table (based on Traction Target Error and Ground Speed Limiter)
Pedal to Throttle Area Demand Translation Table Control
As mentioned at the start, there are 3 tables which can be control in a variety of ways. The following options are available
0: N/A (Tables OFF)
1: ON – Table 1 (Table 1 Available)
2: ON – Table 2 (Table 2 Available)
3: ON – Table 3 (Table 3 Available)
4: N/A
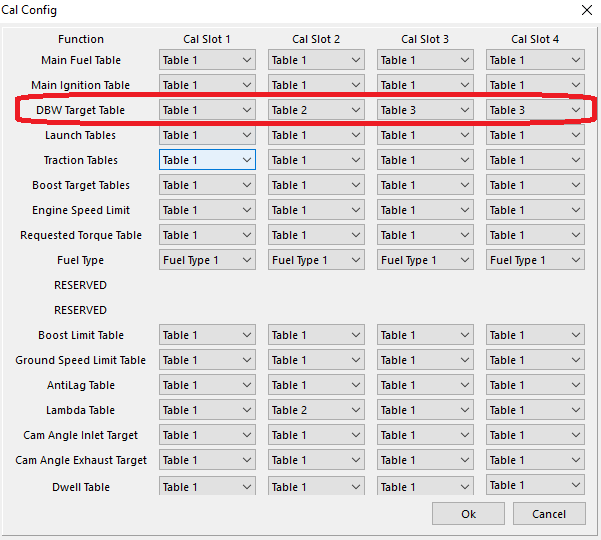
5: Cal Slot (Cal Slot Control selects active table)
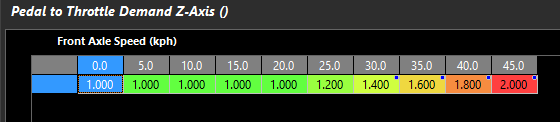
6: ON – Z-Axis (Z Axis Table selects/blends active table)
7: ON – Table 1 = DBW 1/Table 2 = DBW2 Air Bleed
Modes 1-3: Activate individual tables
** Mode 1 is most common (Table 1 activated)
Mode 5: Allows Cal Slot Control to select the active table (See Cal Slot Control)
Mode 6: Enables a Z-Axis table that allows selection/blending of the active table,
Axis based on Front Axle Speed. Units are active table
Mode 7: Allows two different drive by wire servos to have different targets. DBW Servo 1 controlling the main airflow into the engine, and DBW Servo 2 being used for a different purpose like DBW Air Bleed on turbocharged or supercharged engines.
Example
Pedal to Throttle Demand Translation Table 1 = DBW 1 Control .
Pedal to Throttle Demand Translation Table 2 = DBW 2. This is used for compressor surge control by venting excess air the engine cannot use.
This is a good example of how Emtron allows you to layer multiple functions together to obtain a desired result
Pedal Position Demand Filter
Introduction
The ECU takes the raw Pedal Position Sensor 1 input, passes it through exponential filter to help smooth out signal fluctuations, then generates a new runtime Pedal Position Demand.
Pedal Position Sensor -> EXPONTENTIAL FILTER -> Pedal Position Demand
The filter coefficients for the exponential filter are adjustable using a table. These filter coefficients can be used to heavily filter small throttle corrections, while allowing large throttle changes to have little or no filtering. By heavily filtering small throttle corrections, throttle sensitivity can be reduced, helping the throttle “feel” when driving over bumpy roads or when making small throttle changes. Little filtering when making large throttle changes helps to give a fast throttle response when a large acceleration or deceleration is requested.
See the DBW Torque Management help topic for more information on the process of converting Pedal Position to Throttle Area to DBW Servo target.
Pedal Position Demand Filter Lockouts
These settings allow for the lockout of the pedal filter based on the pedal position.
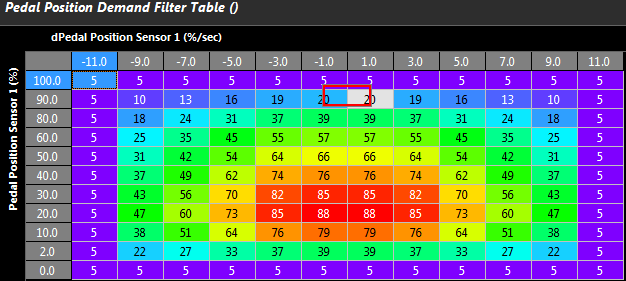
Pedal Position Demand Filter Table
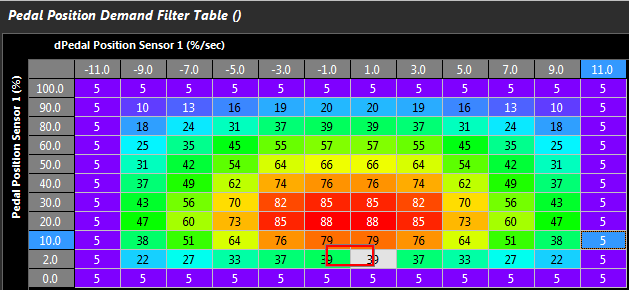
This controls how much filtering is applied. It is common to filter heavily at low rates of pedal position sensor output in order to achieve a smooth driver torque demand.
0 = Filtering OFF
99 = Max Filtering
= Important Note:
It is strongly recommended to span the table axis as follows:
X - Axis = Rate of Pedal Position sensor change
Y - Axis = Pedal Position Sensor
Example
Using dPedal Position Sensor 1 and Pedal Position Sensor 1, the Throttle Area Demand can be softened at low dPedal rates whilst also giving the ability to change the filtering based on the raw pedal position.
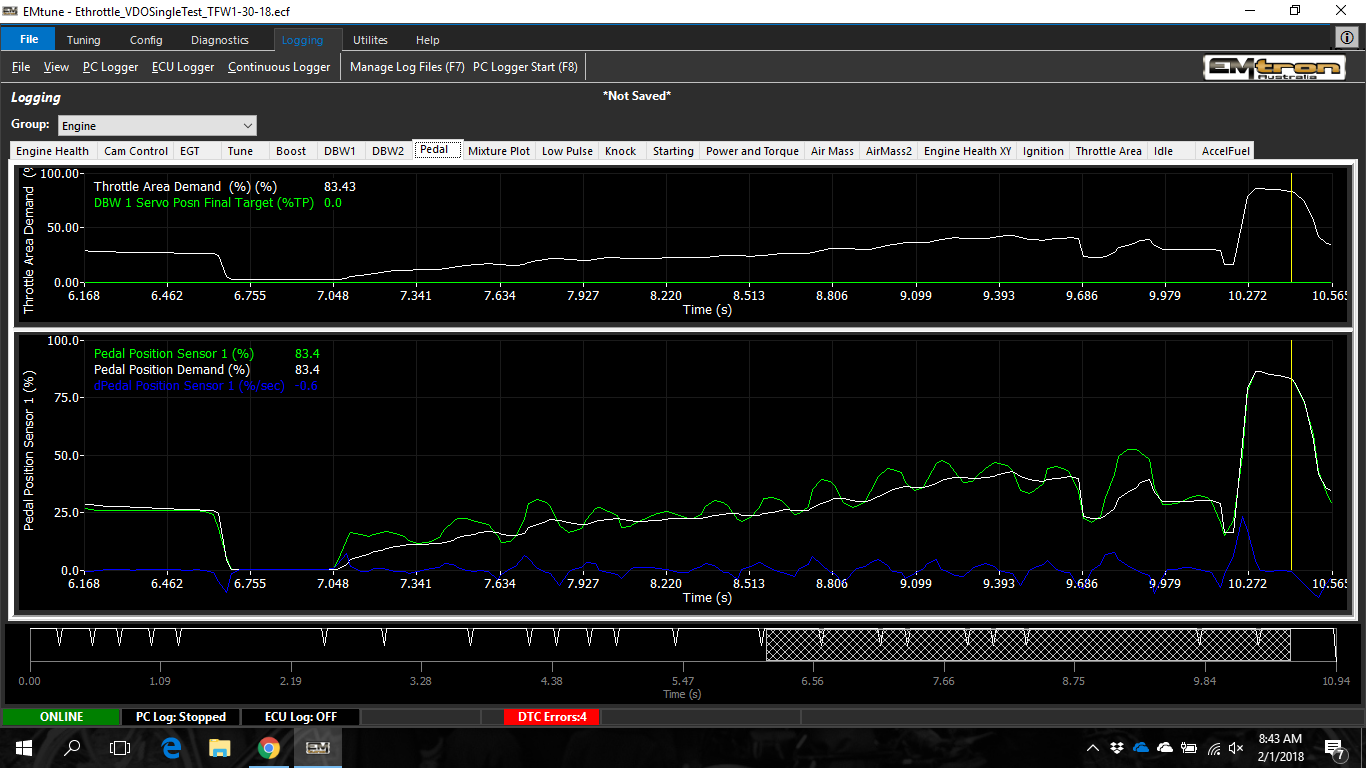
Reviewing PC/ECU logs will allow the user to achieve the desired effect.
Top Plot (white trace) shows Throttle Area Demand
Bottom Plot shows the Pedal Position Sensor (green trace) vs Pedal Position Demand (white trace)
Driver Demand Torque Correction Table
Driver Demand Torque Correction Table
Driver Demand Torque is calculated based on various parameters in the ECU along with driver controlled pedal inputs.
If however there are correlation errors between the actual Engine Torque and Driver Demand torque, these can be trimmed using this table.
The range is 0.000 to 2.000. A value of 1.000 being equivalent to the calculated torque demand without correction. As with the Engine torque correction table the default table is produced using only the the X axis as an example. However both the X & Y axis are available and can be enabled at any time in the axis setup form.
Note: The Driver Demand Torque is calculated fully Independent to the Engine Torque, so there will always be a small error between the two. A normal and acceptable error is around 10%. For example Driver Demand Torque might be 470Nm and Engine Torque 490Nm. This is an acceptable error & not unusual.
DBW Torque Management
Introduction
The ECU uses a torque based system for DBW throttle plate control, which means all torque requests are done using Throttle Area, not Throttle Position.
There is no direct DBW Servo Position “Target” table, but instead a Throttle Area Demand table (more information below). So the throttle area directly relates to the engine torque which is why this function is under Torque Management.
For Engine torque calculations and during Torque limiting events the ECU converts the engines throttle area into engine airflow (g/s), then into engine torque (Nm) using mathematical models. This model allows the ECU to use this calculation in either direction:
Throttle Area -> Airflow -> Engine Torque. Starting with throttle area the ECU can calculate the engine torque.
Torque Target -> Airflow -> Throttle Area Target. Starting with a torque Target, the ECU can target a throttle plate area to achieve that torque.
Throttle Area data is available either in the Runtime menu(F3) -> Torque or DBW 1/2 tab. The “Throttle Area Demand Status” indicates the current throttle area in use.
How does the ECU then convert throttle area to DBW servo position target?
This is done using the “Throttle Body Area Table " which translates Throttle Area into Servo Position. The ECU uses this as a lookup table, converting any requested Throttle Area into a Servo Position target for the DBW system. See the Throttle Body Area help topic for more information.
The process of converting Pedal Position -> Throttle Area Demand -> DBW Servo Target
To understand the process of converting Pedal Position into Throttle Area, carefully read this section.
Note the Throttle Cranking Area table. This ONLY gets applied during cranking and overrides any pedal request. See Cranking Throttle Area Demand
The Pedal Position Sensor goes through a pedal position filter table to give you Pedal Position Demand . This will help smooth out signal fluctuations and improve the driving experience. Press H to read the help below the table. So this step is Pedal Position Sensor -> Pedal Position Demand

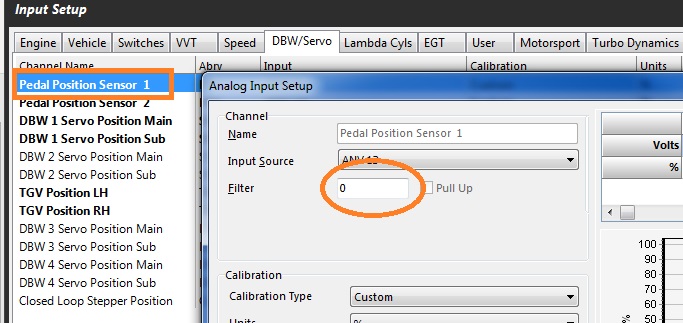
**Tuning Tip**: To avoid large input delays from the Pedal Position Sensor the filter setting on the raw input should be keep small . i.e the input filtering is done during the **Pedal Position Sensor -> Pedal Position Demand** so minimal filtering is required on the raw Pedal Position Sensor Input (See Config View -> Channels -> Inputs Setup -> DBW/Servo Tab). A Typical value will be between 0 - 4.
The new Pedal Position Demand should be used to span the Pedal to Throttle Area Demand Translation Table 1. This demands a Throttle Area (not a position). This table controls the “feel”, making the engine feel more responsive or less responsive by controlling the Torque demand through Throttle Area.
So this step is Pedal Position Demand ->Throttle Area Demand
In this last step the ECU will convert the Throttle Area Demand into the Servo Position Target for the DBW function. This is when the ECU uses the “Throttle Body Area” table mentioned at the start of this section. The ECU uses this as a “lookup” table to convert the Throttle Area Demand into a DBW Servo Position Target.
So this final step is Throttle Area Demand -> DBW Servo Position Target
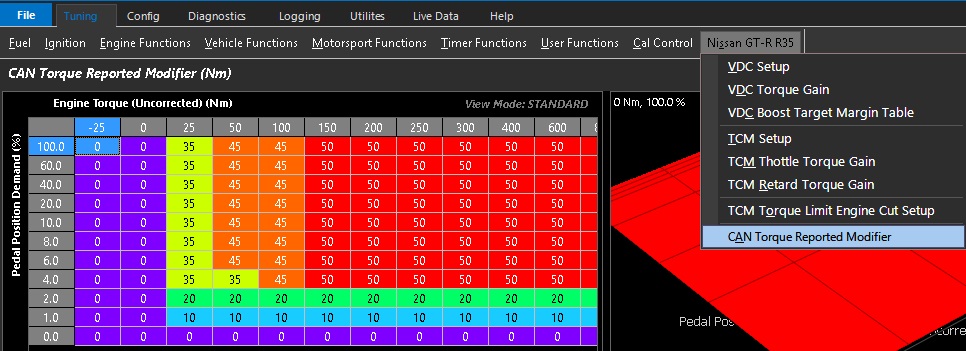
Torque information transmitted over the CAN bus can be modified using two separate tables: one for Engine Torque and one for Driver Demand Torque.
These tables allow the transmitted torque values to be modified to alter how other vehicle systems respond to the torque information, such as traction control, transmission, and other torque-dependent systems.
This can change the behavior of the Gearshift along with clutch pressure in gear. If there is excessive slip typically the Torque reported should be increased. If the gearshift feel is too sharp and aggressive the Torque reported should be reduced.
The table(s) apply an Nm offset.
Table range is +/- 1000.0 Nm
Example: Gearbox
The above example shows a typical setting.
The increase in Torque reported over the CAN bus will have the effect of sharpening the transmission shifting and clutch lockup.
NOTE: It is important to note that directly programming the TCM through a third party flashing tool is advised over using the ECU to offset the torque reported.
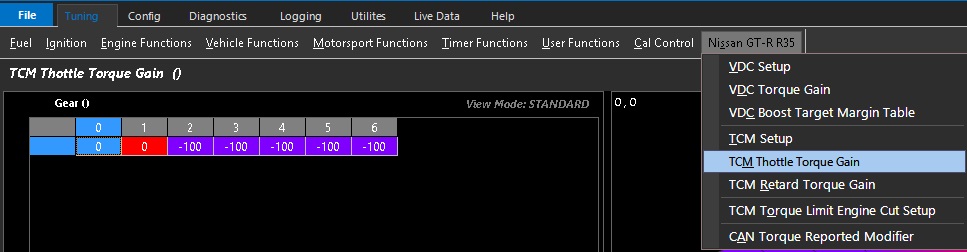
TCM Throttle Torque Gain
TCM Throttle Torque Gain
Torque Limit Strategies
Torque Reduction Strategy Priority
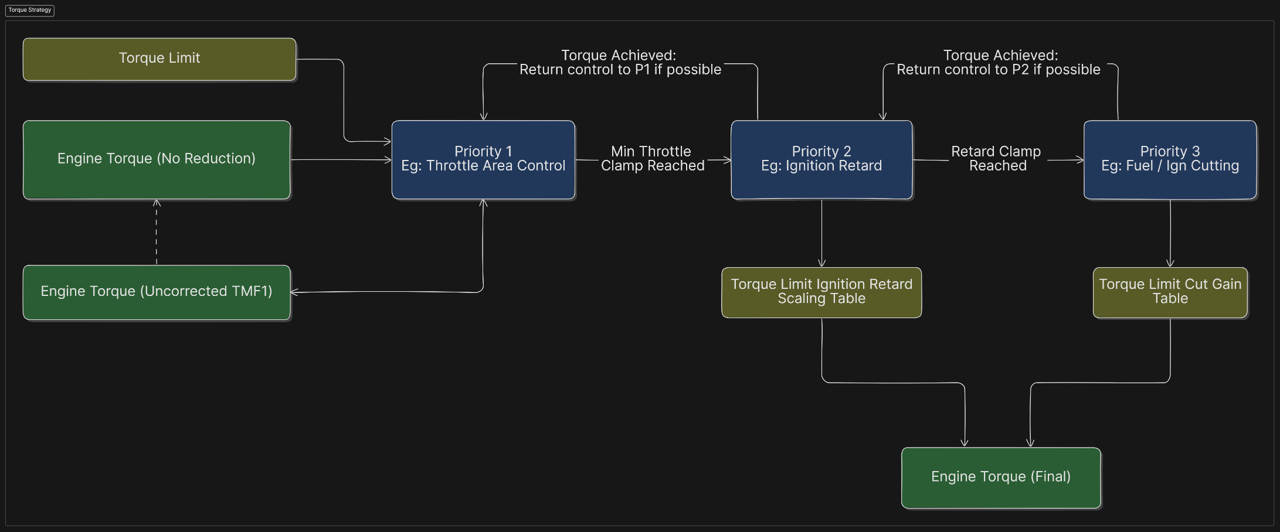
The ECU provides five Torque Reduction Strategy (Strat Modes). Each Strat Mode has three configurable priority levels that define the preferred order in which the available torque reduction methods are used.
Functions throughout the ECU that request torque reduction can select which Strat Mode to use. For example, Launch Control and Traction Control can each be configured to use a specific Strat Mode.
Each Torque Reduction Strategy (Strat Mode) can use a combination of three torque reduction methods:
Priority
Torque Reduction Method
0
Throttle Area
1
Ignition Retard
2
Fuel / Ignition Cutting
Three priority levels are available to determine the preferred order in which these methods are used to achieve the requested torque target.
The highest priority method is always used first. If it cannot achieve the requested torque target, the ECU will use the next priority method. This can occur when the selected method reaches a configured clamp or when the required change in throttle air mass takes time to occur. (ie Priority 2 can help reduce torque until Priority 1 method reaches its target)
This priority system is particularly useful during long or sustained Torque Limit conditions, allowing the ECU to use the preferred torque reduction method while automatically using additional methods when required.
Example:
The following priority is configured:
Priority 1: Throttle Area
Priority 2: Ignition Retard
Priority 3: Fuel / Ignition Cutting
Ignition Retard Maximum Clamp: 15°
When the Torque Limit becomes active, the ECU begins transitioning the Throttle Area towards the position calculated to achieve the requested torque target.
During this transition, the throttle air mass does not change instantaneously, so the requested torque target may not initially be achieved. The ECU therefore uses Priority 2 and applies the calculated Ignition Retard required to achieve the torque target.
If the torque target is still not achieved and the Ignition Retard reaches the configured 15° maximum clamp, the ECU moves to Priority 3 and applies Fuel / Ignition Cutting to complete the required torque reduction.
As the throttle area continues to transition and provides sufficient torque reduction, the ECU progressively removes the Ignition Retard. Once the throttle area can independently sustain the requested torque target, no additional torque reduction method is required.
This allows the ECU to use the preferred torque reduction method whenever possible while automatically applying additional methods when required to achieve the requested torque target.
Strat Mode Torque Reduction Clamps
Each torque reduction method has a configurable clamp that limits the maximum amount of reduction that method can provide. If the requested torque target cannot be achieved and the configured clamp is reached, the ECU moves to the next priority level.
Throttle Area – The Throttle Area Minimum Clamp Table defines the minimum throttle area that can be requested. If the requested torque target cannot be achieved and the minimum throttle area is reached, the ECU moves to the next priority.
Ignition Retard – The Ignition Retard Maximum Clamp Table defines the maximum amount of ignition retard that can be applied. If the requested torque target cannot be achieved and the maximum retard is reached, the ECU moves to the next priority.
Fuel / Ignition Cutting – The Engine Cut Maximum Clamp Table defines the maximum amount of engine cut that can be applied. If the requested torque target cannot be achieved and the maximum cut is reached, the ECU moves to the next priority.
Torque Limit Gain Tables
Torque Limit Ignition Retard Gain Table
This table calibrates the torque reduction % per degree. When a torque request is applied the ECU will calculate how much retard is required to achieve this torque request.
Example : 1.5%/ Deg.
The Engine is running at 600Nm and a Torque Reduction to 400Nm is requested.
This is a 33% reduction in Torque so at 1.5%/Deg the ECU will Retard the Ignition 22 Degrees.
(33% / 1.5%/deg = 22 Deg)
Example : 16 degrees of ignition trims (Ignition Trims Total) are being applied - for any reason (comps, secondary load, etc)
The ECU will calculate 20% of torque reduction - can be observed with Runtime “Torque Reduction - Retard (Nm)”
See default table settings below.
Torque Reduction Ignition Retard Gain Table
Torque Limit Cut Gain Table
This table calibrates the torque reduction % per %cut. When a torque request is applied the ECU will calculate how much cut is required to achieve this torque request.
See default table settings below.
Torque Reduction Cut Gain Table
Torque Limit Boost Target Margin Table
During Torque Limiting the ECU calculates (when enabled) the Minimum Boost Target required for the engine to achieve this Torque. The engine actually needs more than this minimum for the Throttle Mass Limiting to be effective so the " Boost Target Margin" is added to this value.
Example: ECU calculates a Boost Target of 150 kPa. If Boost Target Margin is 20kPa, the final Boost Target during Throttle Mass Flow Limiting will be 170kPa
User Torque Limits
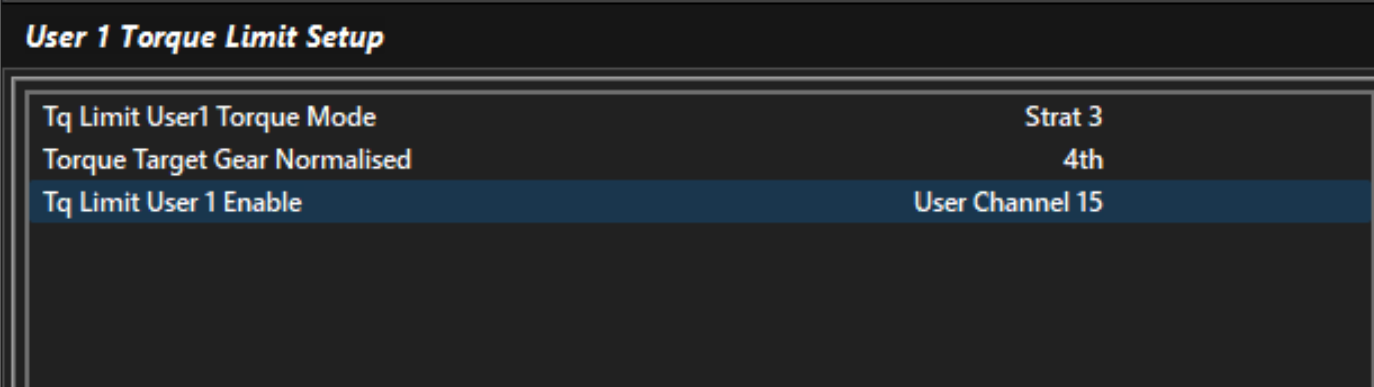
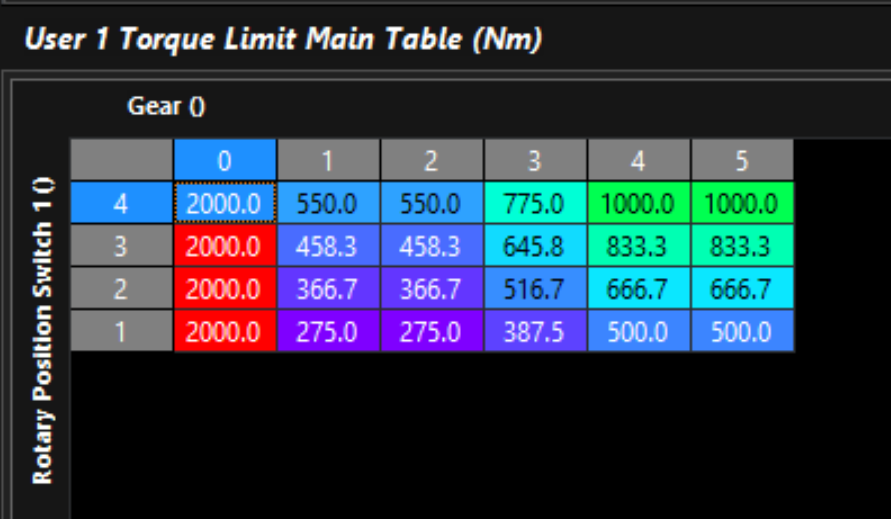
In addition to Motorsport and special features included in the firmware that utilize Torque Management (Launch Control, Traction Control, Engine Speed limiting), there are 5 User Configurable Torque Limits.
User Torque Limits 1-5
User Torque Limit Function Setup
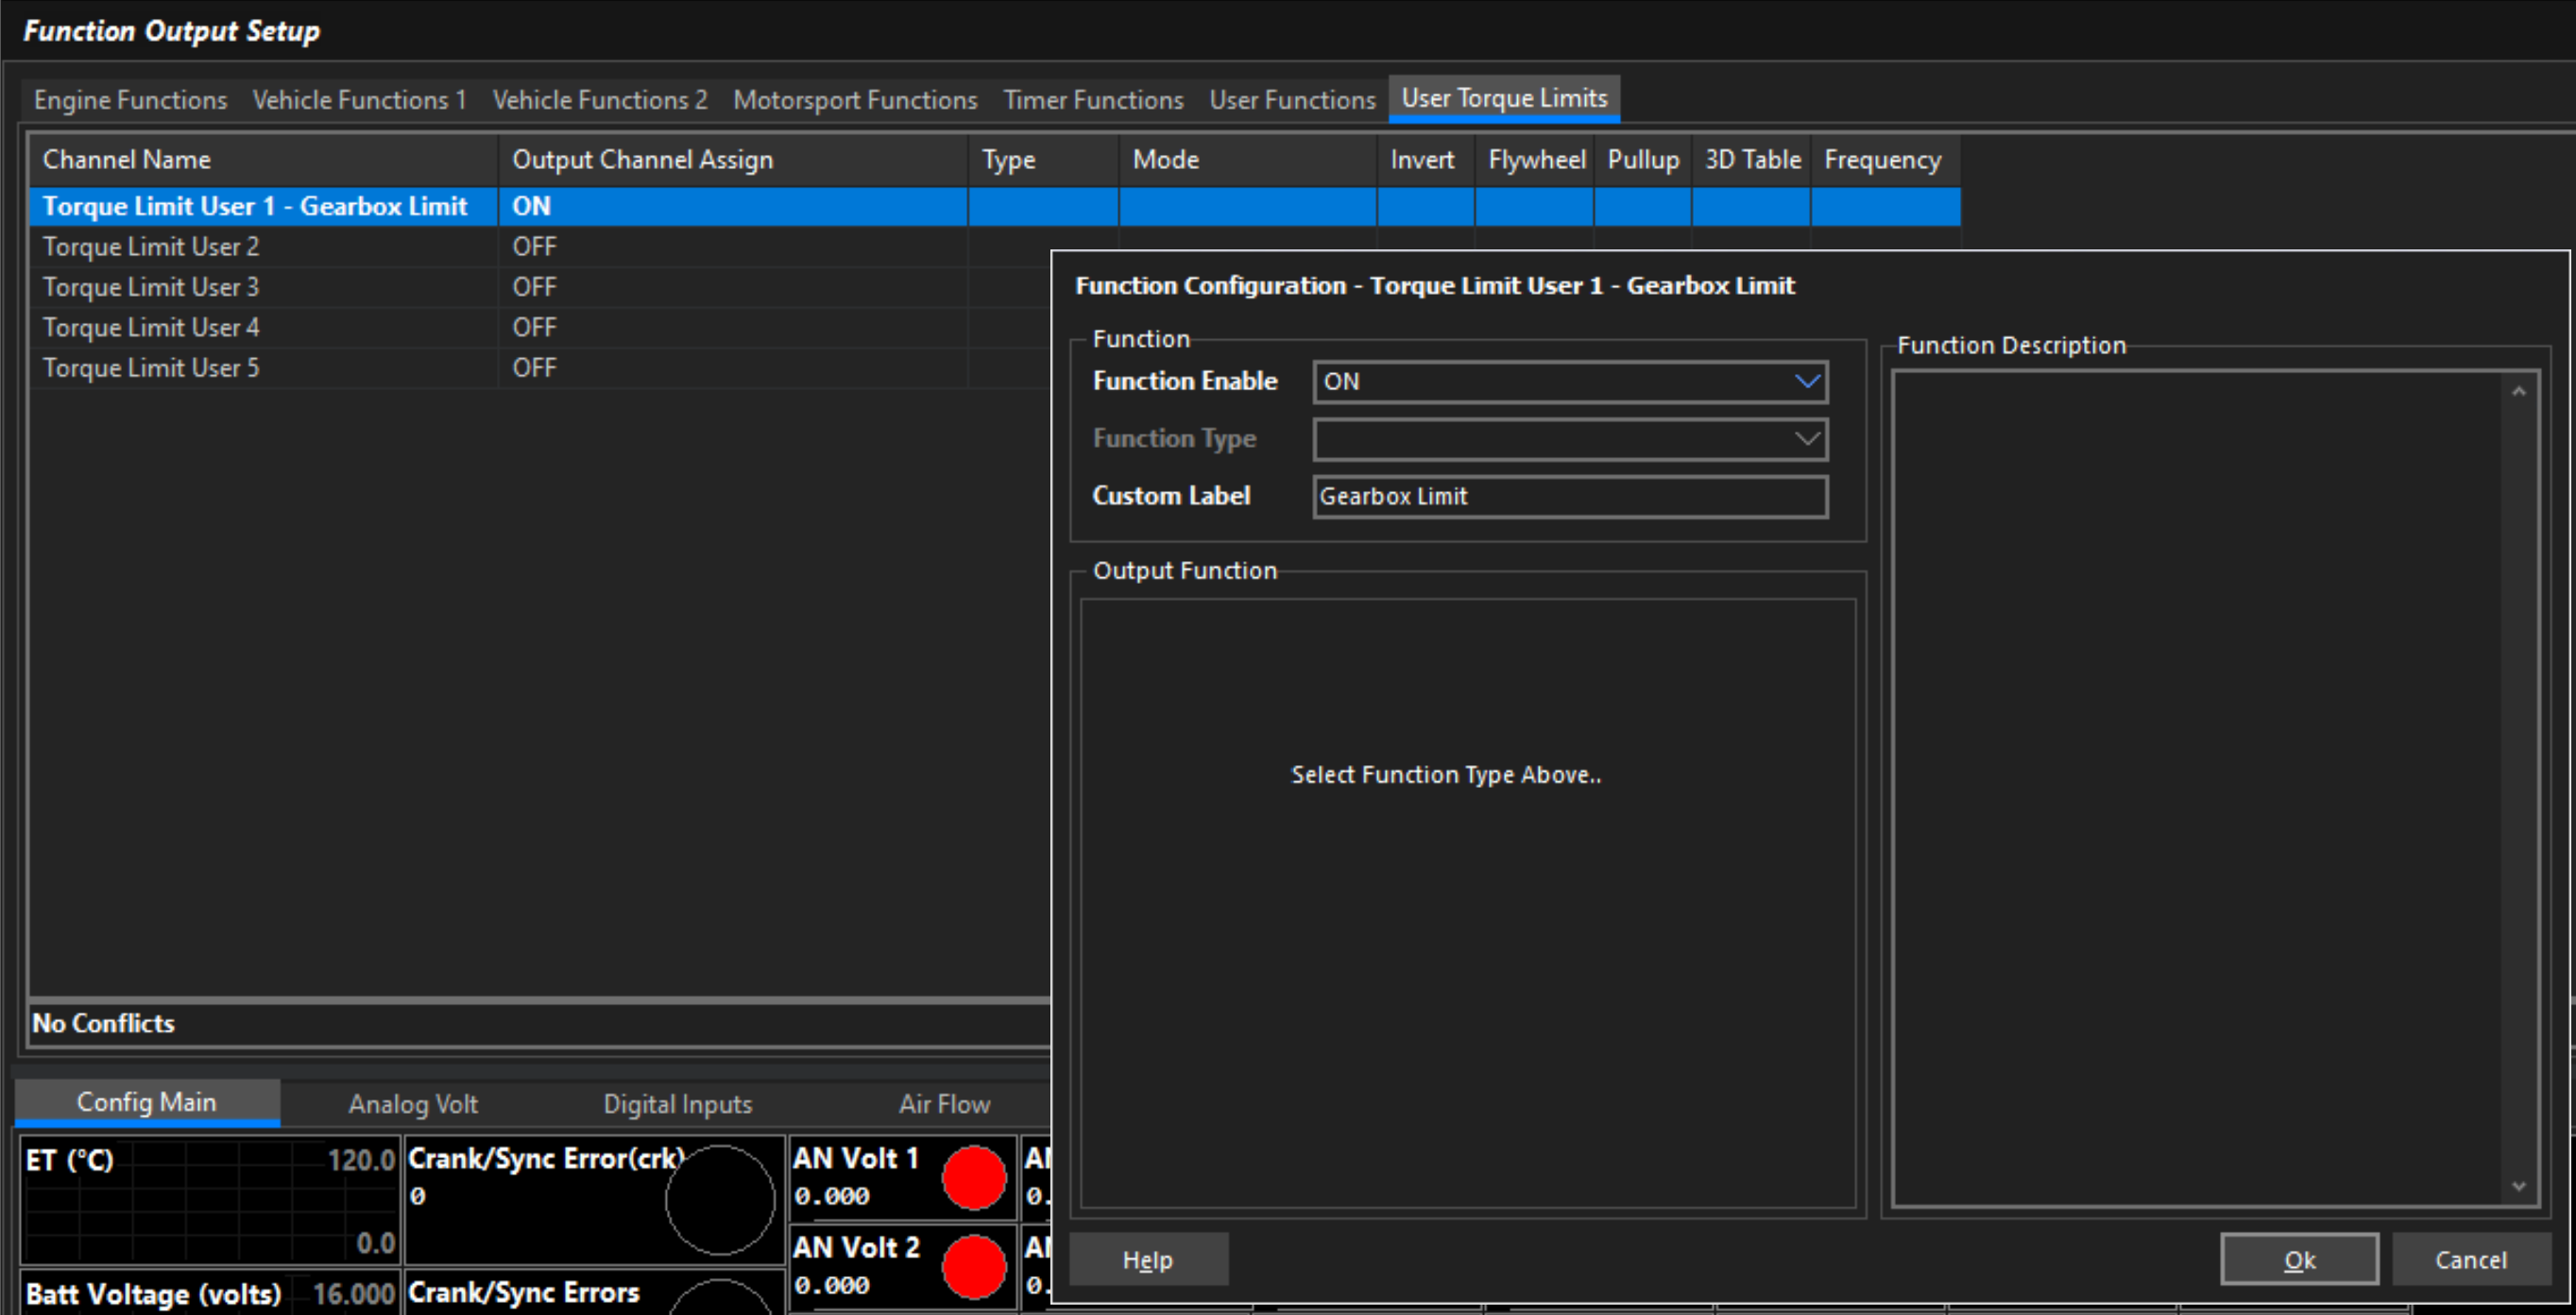
The User Torque Limits must be enabled in the Function Output Setup
Furthermore, a Custom Label can be assigned to the function