Scope Utility
Access Scope under
- Utilities, Scope
When you select Scope, it opens a new window with the Scope.
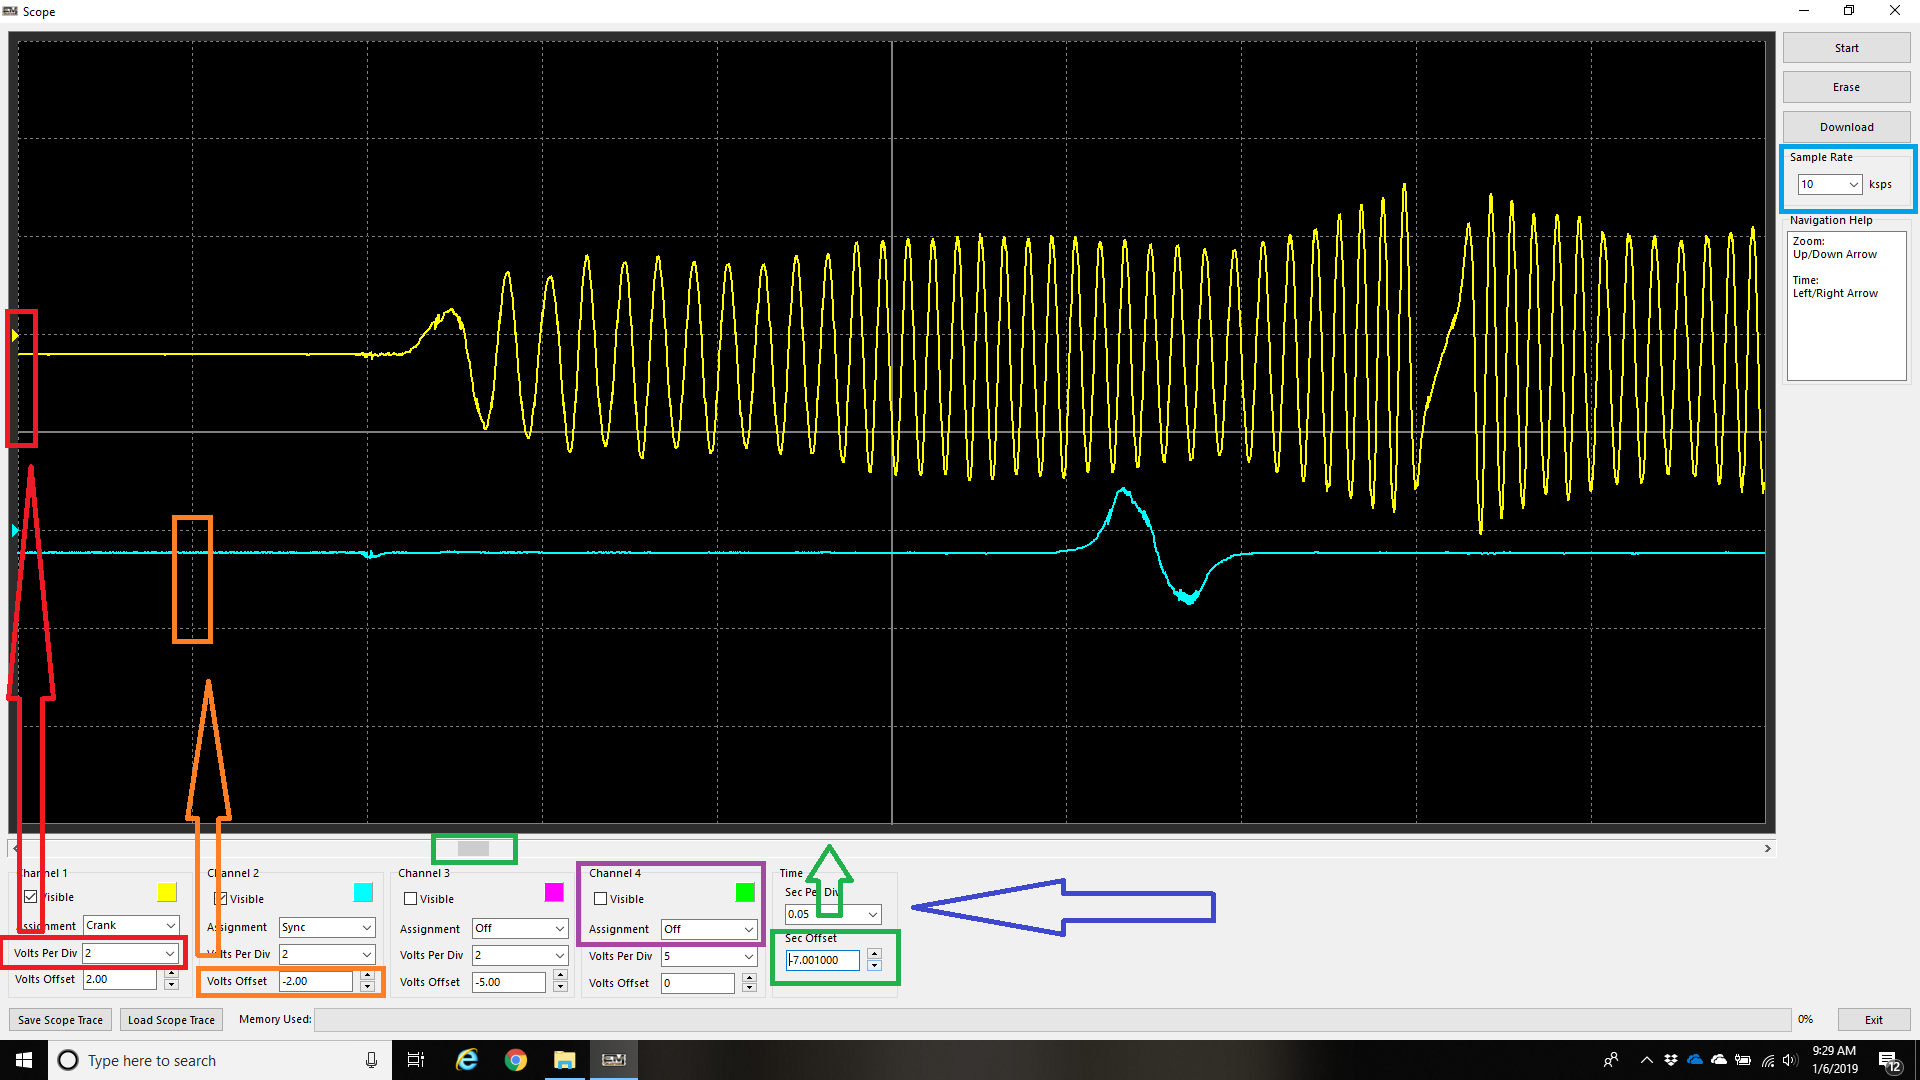
The scope function records the channel assignments to internal memory when started/stopped with the buttons at the top right. The memory can be subsequently downloaded, erased, saved, and loaded by the other buttons in the utility.
Configuration details are as follows:
Purple:
Select what channel to display, and whether you want the trace to be visible or not
Red:
Change the volts per division for each channel
The chart is divided in blocks up and down. Each block equals 2 volts in the above example.
Orange:
The traces can be offset so they do not overlay on top of each other. The default value is 0.00V, meaning the voltage will trace from the centre (so it will read +/- 0V). It is useful to offset the traces, so they can be all visible at the same time on the chart as in the above example.
Green:
Sec Offset moves the trace to a specific position
Blue:
Time Sec Per Div changes the zoom level of the scope by adjusting the time per division horizontally. Like voltage per division vertically. After starting and stopping the scope, this will need to be adjusted until a trace draws an appropriate picture as in the example above.
Light Blue:
Sample Rate should be adjusted to set the scope recording rate. In most cases the default value of 10ksps should be enough, but if scope traces are requested for troubleshooting purposes (on running engines for example – not just for trigger decoding requests), then a higher speed may be requested.
** Note a higher sampling rate will use up the Emtron internal memory much faster. A shorter period of recording should be anticipated (a few seconds generally).