0: Speed Density (MAP)
Speed Density (MAP Sensor)
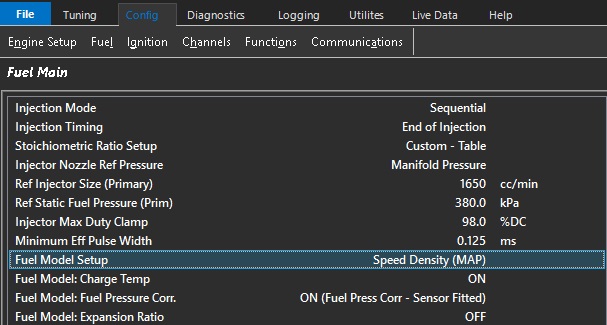
The ECUs primary Fuel Model is Speed Density(MAP Sensor). The basis of this calculation is derived using the Ideal Gas Law; PV = nRT.
The ECU calculates the injection time for speed density using the following information:
Displacement volume per cylinder (cc).
Intake Manifold Air Pressure - MAP(kPa)
Lambda Target (La)
Stoichiometric Ratio of the Fuel (Stoich)
Injector Flow rate (cc/min)
Charge Temperature (DegC)
Fuel Density (g/ml)
Fuel Pressure (kPa)
Engine VE (%)
Gas Constant - R = 287J/Kg/K for Dry Air.
The Fuel Mass (g) is calculated as:
Fuel Mass (g) = MAP x Volume Per Cylinder x 1 x 1 x Engine %VE
287J/Kg/K x (Charge Temp(DegK) Stoich Lambda Target
Example 1:
MAP = 252kPa
Charge Temperature = 30.7 DegC
Volume Per Cylinder = 666.6
Stoich Ratio = 9.9
Lambda Target = 0.785
Engine VE = 96.6 %
Fuel Mass (g) = 0.2395
In this basic example, if the cylinder is filling to 96.6% of its volume, then 0. 2395grams of fuel is required to achieve a Lambda Target of 0.785.
The Fuel Table(s)are used to compensate for the volumetric efficiency (VE) of the engine at varying Engine Speeds and Loads. These tables represent the True VE of the engine. A typical table is shown in Figure 3 for a turbo charged engine.
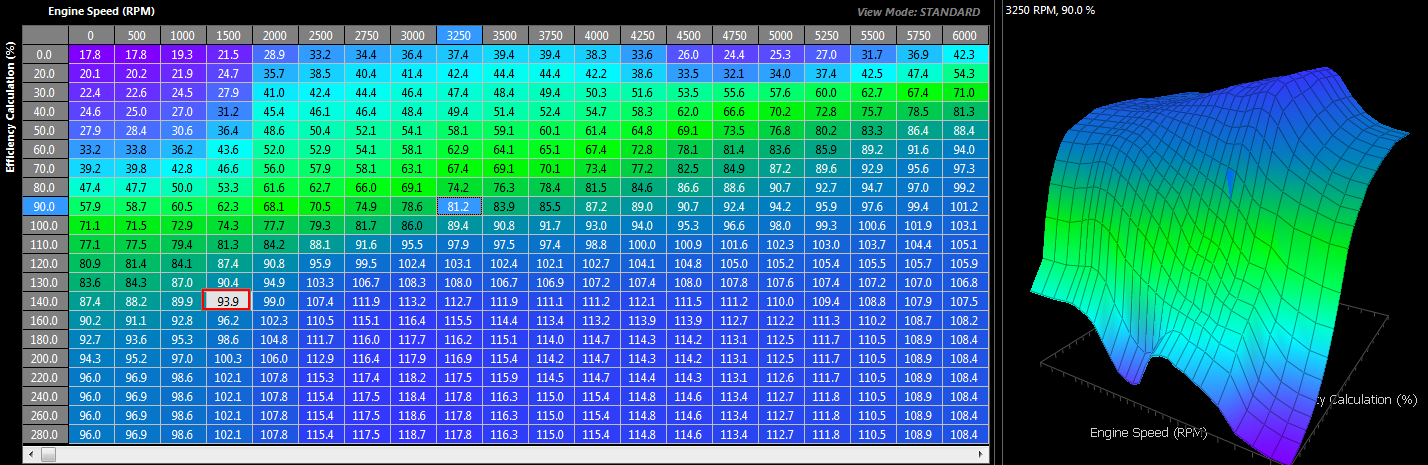
Figure 3: Fuel VE Table
Also, the Stoichiometric Ratio will vary with Fuel Type. A Single Zone if the fuel type is fixed (Figure 4) can be used or a Table allowing the ECU to constantly correct for varying alcohol content. See Figure 5.
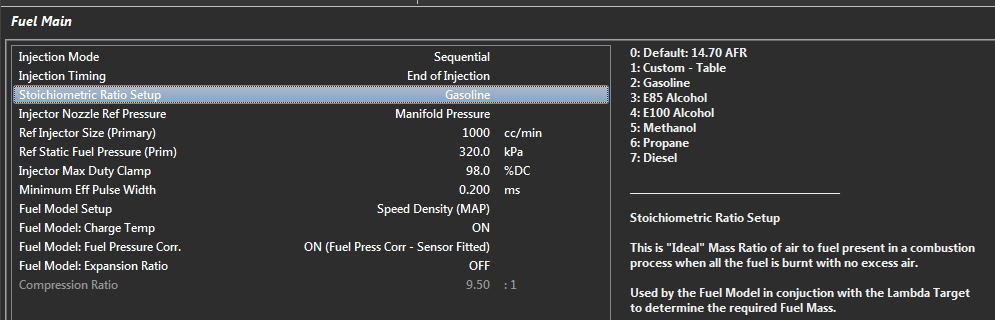
Figure 4: Stoich Ratio setup (single )
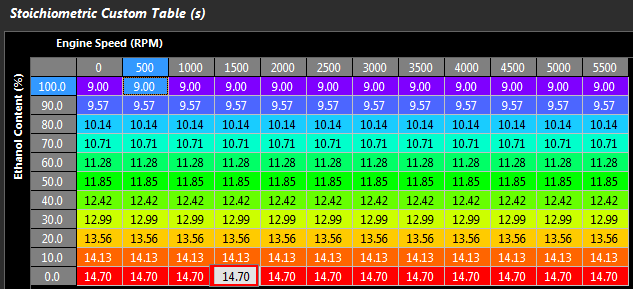
Figure 5: Stoich Ratio setup (table)
Once the Fuel Mass is determined, the Effective Injector Pulse Width can be calculated using
-
- Injector Size
- Fuel Density. Fuel Density can be a function of both Fuel Temperate and Alcohol Content. A typical table will look as shown in Figure 6:
- Fuel Pressure Correction. The Fuel Pressure Correction is a Fluid Dynamics equation, also called Bernoulli’s equation. It allows the injector Flow Rate to be adjusted as the differential pressure across the injector changes. NOTE: This correction MUST be enabled using the “Fuel Model : Fuel Pressure” setting
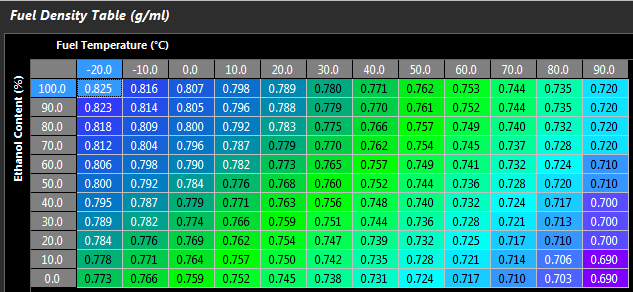
Figure 6: Fuel Density Table
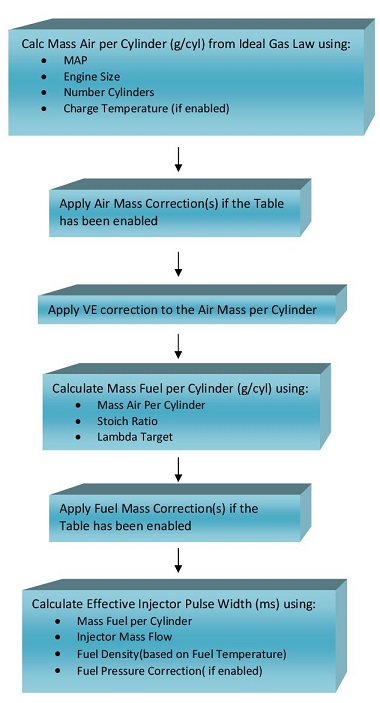
Flow Chart Overview for Speed Density Fuel Model: