Tips on Improving your Emtune tuning efficiency
Tips on Improving your Emtune tuning efficiency:
Methods of validating VE Table
1) Auto Lambda Correction:
Utilise “L” Auto Lambda Correction feature of the software
“L” applies current Lambda Target Error % to live location in map automatically
2) Manual Entry Lambda Correction:
Using “M” key “Manual Entry Lambda correction method”
“M” is pressed & the Lambda target value is imputed together with the measured value. Enter and the result is applied to the highlighted cell.
3)Direct Entry Lambda Correction: The maths value supplied in the target error runtime can be applied to the VE table as you would when using an excel spreadsheet, thereby correcting it. The table is highlighted & the correction manually entered.
Direct entry VE Correction Manual Maths examples:
Rich condition:
Lambda target: 0.864
Lambda 1: 0.782
Lambda Target error: 0.082
Highlight the cell to be corrected – Type 1.082 “/ “
Positive target error = division factor
Lean Condition:
Lambda target: 0.845
Lambda 1: 0.902
Lambda Target error: -0.057
Highlight the cell to be corrected – Type 1.057 “*” (Shift 8)
Negative target error = multiplication factor
Your goal should be to efficiently eliminate or minimise the error between the VE table & the Lambda target table.
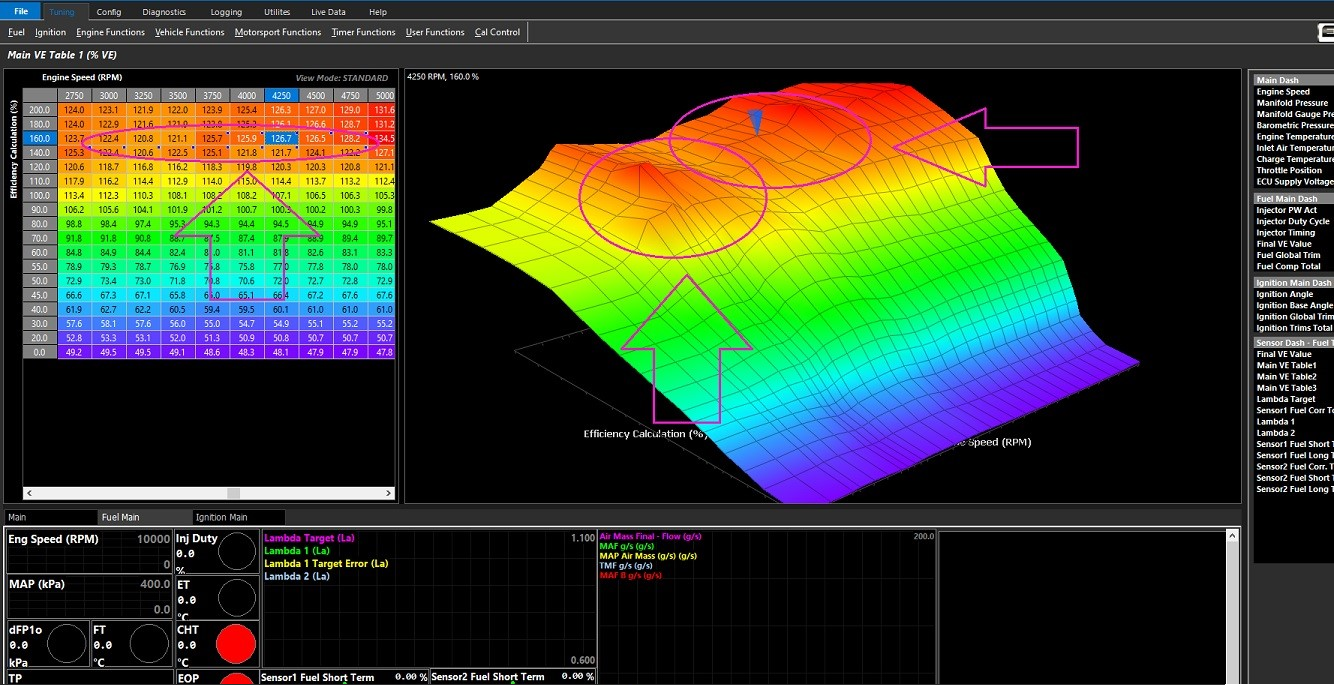
Tip: To use this feature & validate the VE table, alter the dashboard to show not only the Lambda Target and Lambda 1/2, but also the Lambda Target Error.
Utilising “P” key (Pause)
Tuning tables can be quickly validated by utilising the “P” key to pause the live logging in the dashboard independent of the PC logging. This will allow you to drive through an area of a particular table, press “P” & then come back & edit where you have been.
Double clicking the mouse over the desired dashboard runtimes will allow you to move left & right through the paused data using the left & right arrow keys & will also highlight (overlay) the cells referenced in the table being validated.
** “L”, “M”, and Table Maths are all available and usable as if being utilized “live” wherever the curor is “paused”
Live logging recommences when “P” is pressed for the 2nd time.
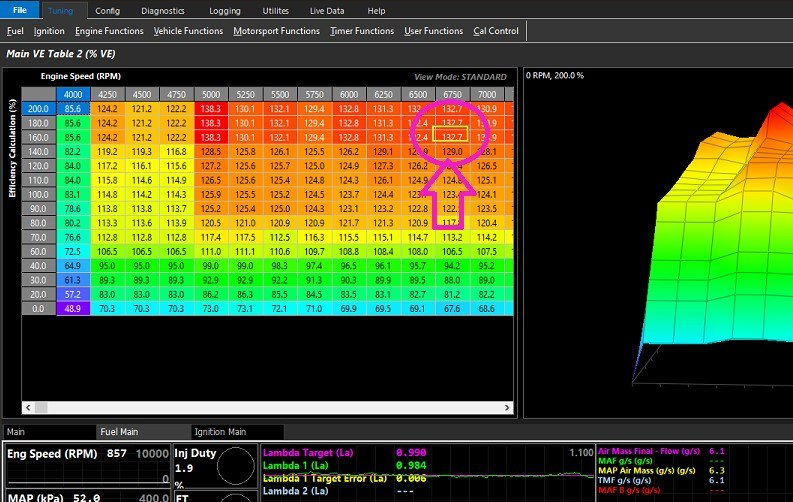
Utilising “O” Toggle Logger Position (The Yellow Box)
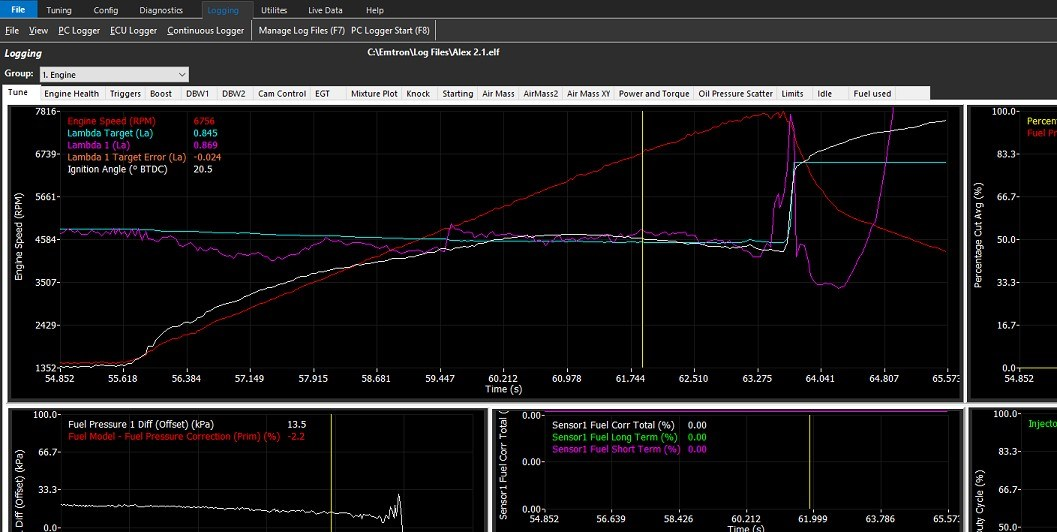
Using the PC logger (F8) the tune can be interrogated against target tune parameters.
Note: Setup your logger view to show the Lambda Target Error not found in default logger layout.
Once an area has been identified that needs attention.
The cursor is moved to highlight this area.
Returning to the referenced VE table in the tuning software.
Pressing “O” will toggle the yellow box over the referenced cell/s.
Lambda vs Lambda target can be utilised via “M” - Manual entry lambda correction.
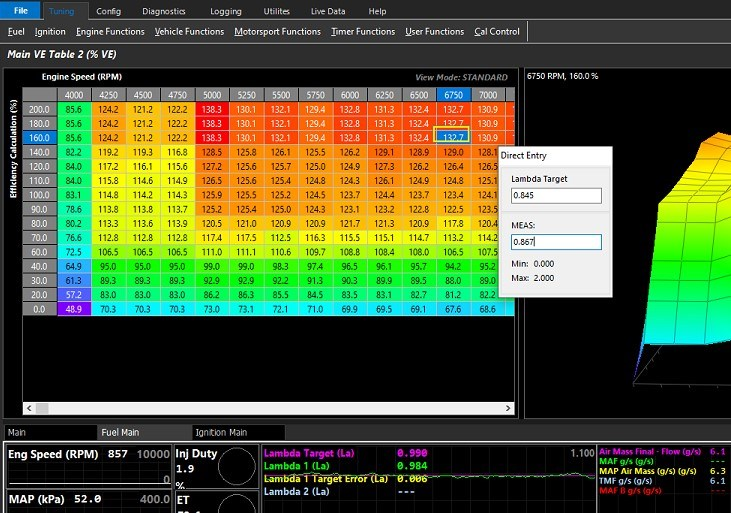
Or direct entry method can be utilised.
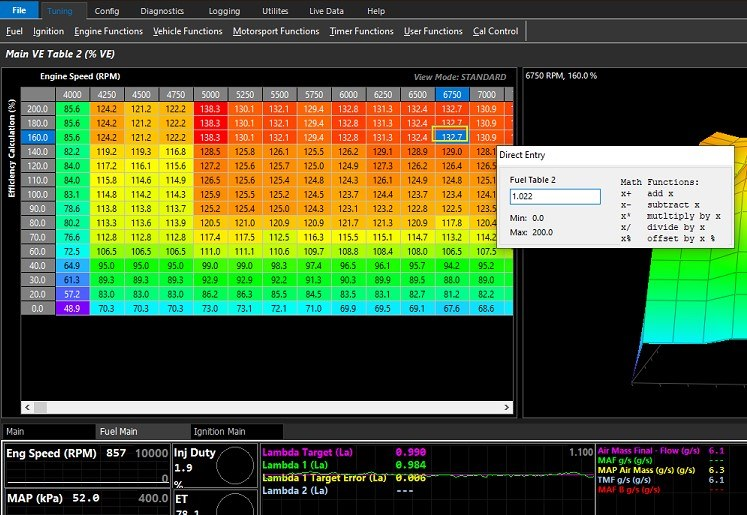
Working example:
Lambda Target is 0.845
Lambda 1 (La) is 0.867
Lambda 1 Target Error (La) is -0.022 % (Lean)
To correct the table simple left mouse, click the referenced cell
Start typing 1.022* (shift 8)
This multiplies the missing percentage of fuel into the VE table thereby validating the table.
Maths values are explained in dropout box once typing commences.
(Rich values are divided)
Your goal should be to efficiently eliminate or minimise the error between the VE table & the Lambda target table.
Utilising “Scatter Plot” Correction
A useful feature of the Emtune logging is the Mixture Scatter Plot.
This is an often overlooked powerful and accurate tool for validating your VE table/s.
By utilising the features of the setup, this table can be utilised as a form of histogram of engine operation.
Note: Scatter plot correction applications are not limited to only VE tables. This method of validation is easily applied to bank trims & more.
Example: Lambda 1 active / Lambda control off
Validation performed on chassis dyno
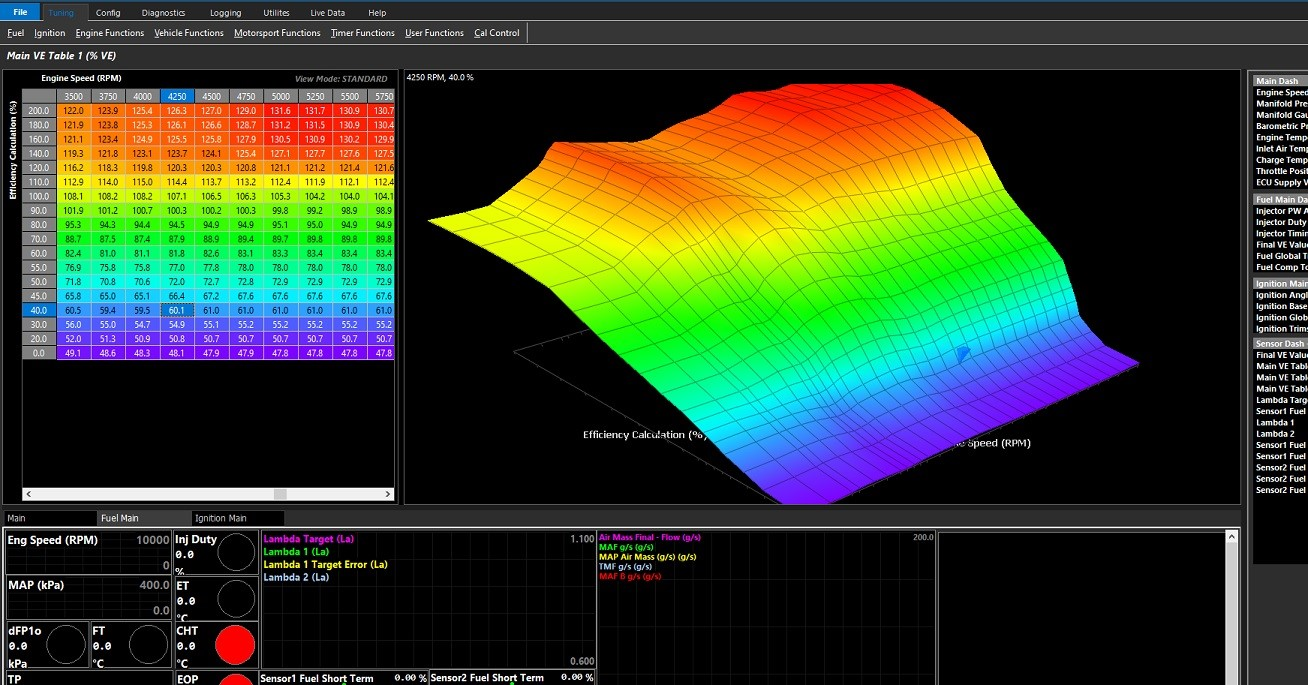
VE Table for purpose of demonstration
The vehicle is driven and a PC log is produced recording the activity
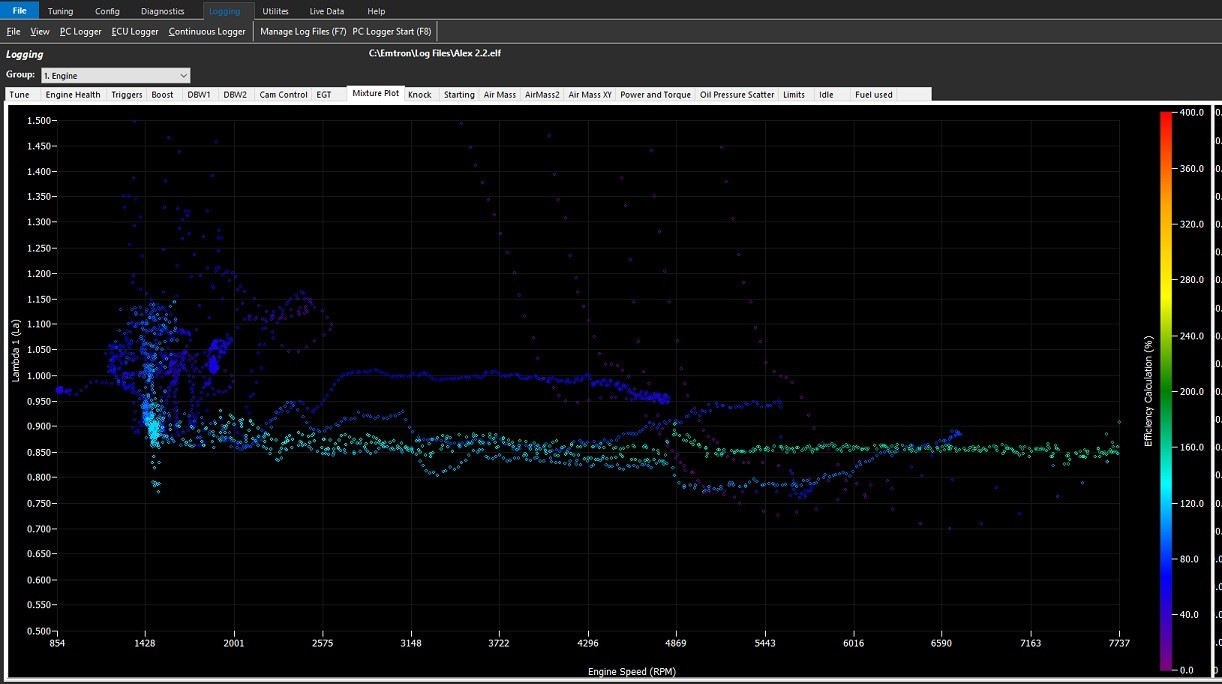
Raw scatter plot is produced
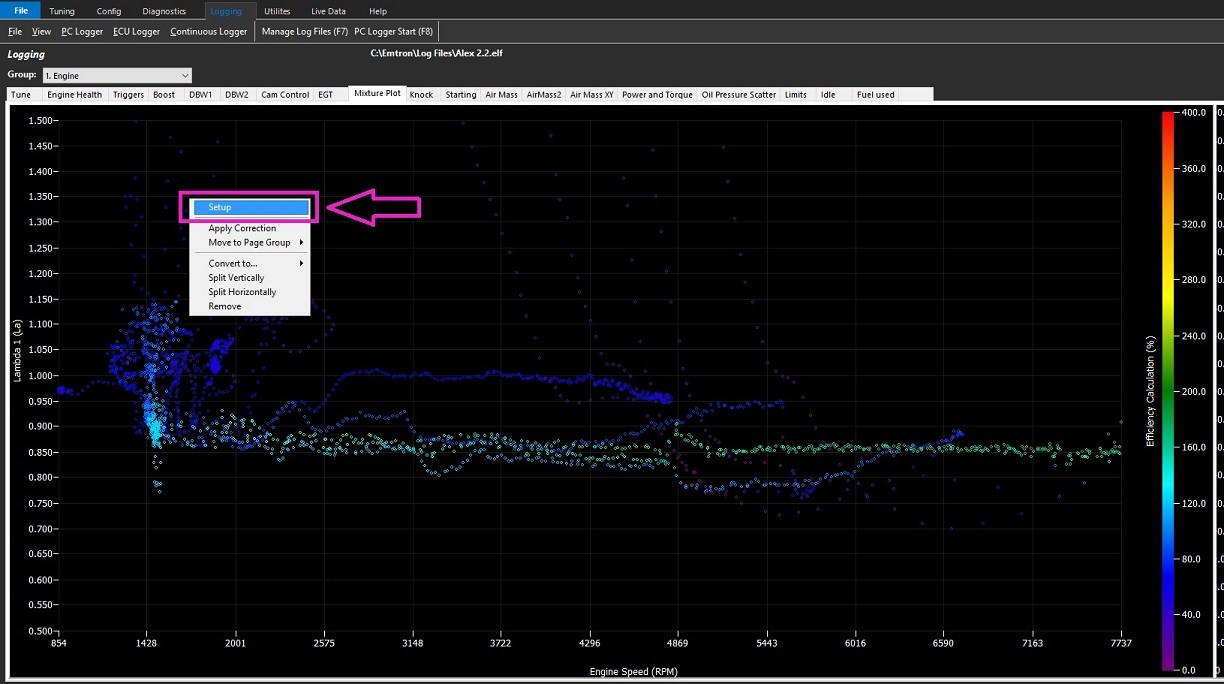
Enter the Scatter Plot Setup (Right Mouse Click)
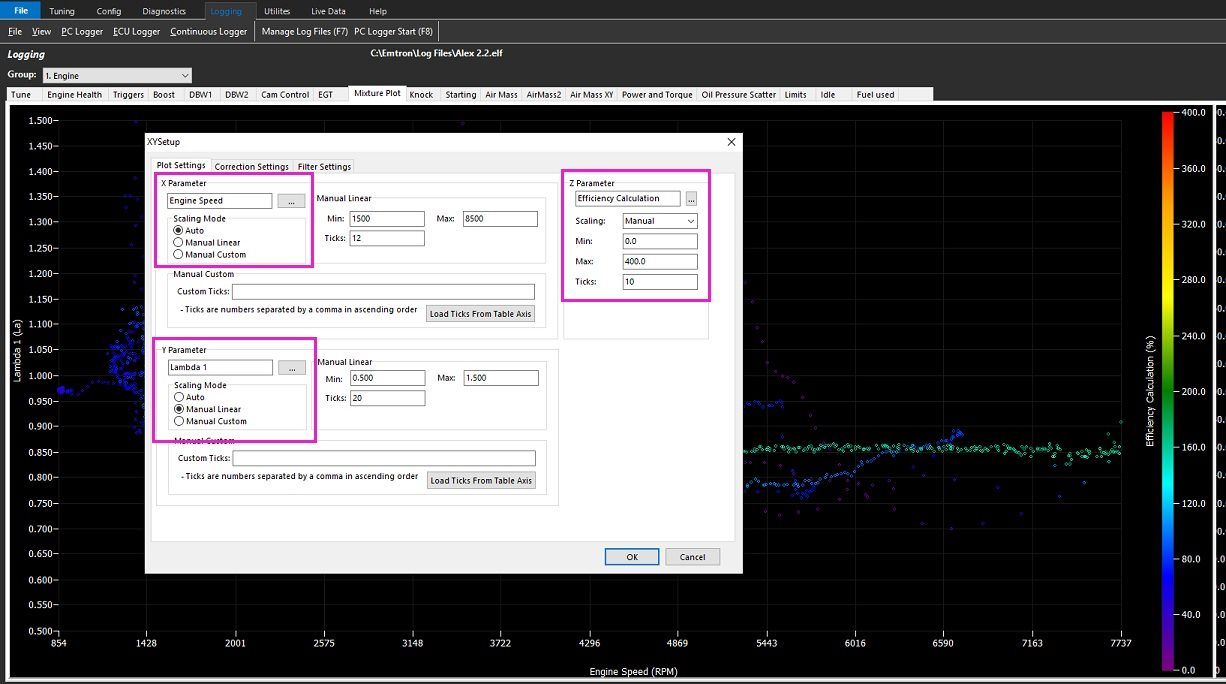
Confirm Plot Settings
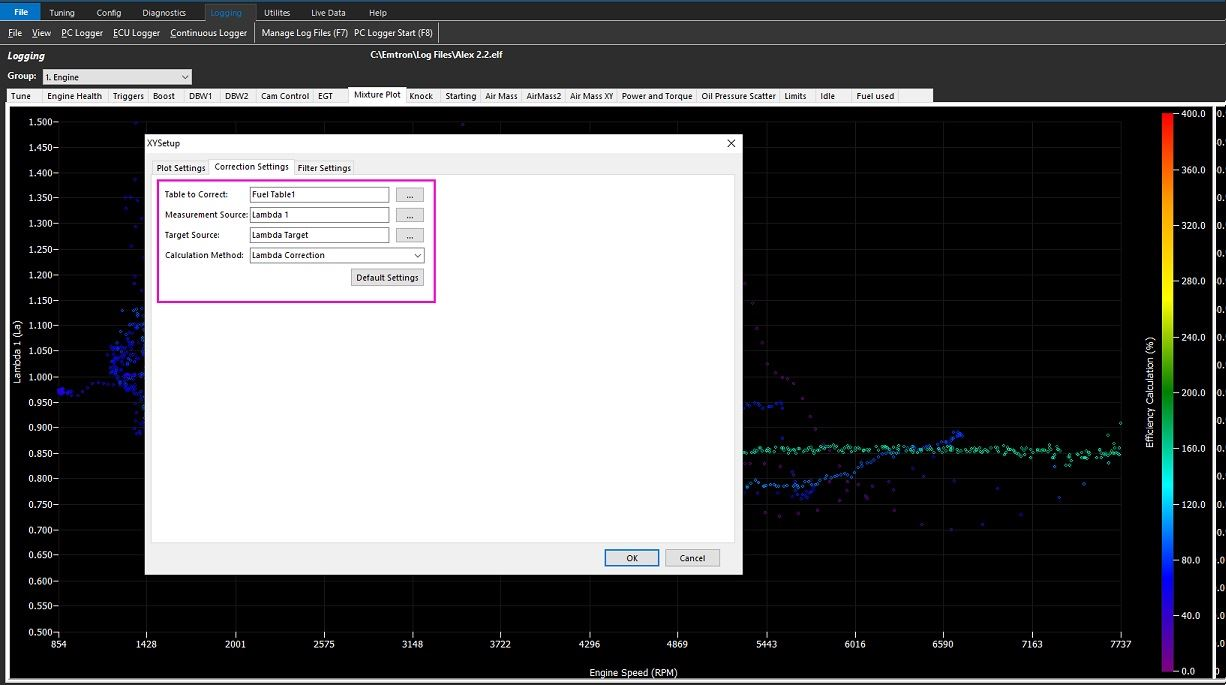
Confirm Correction Settings
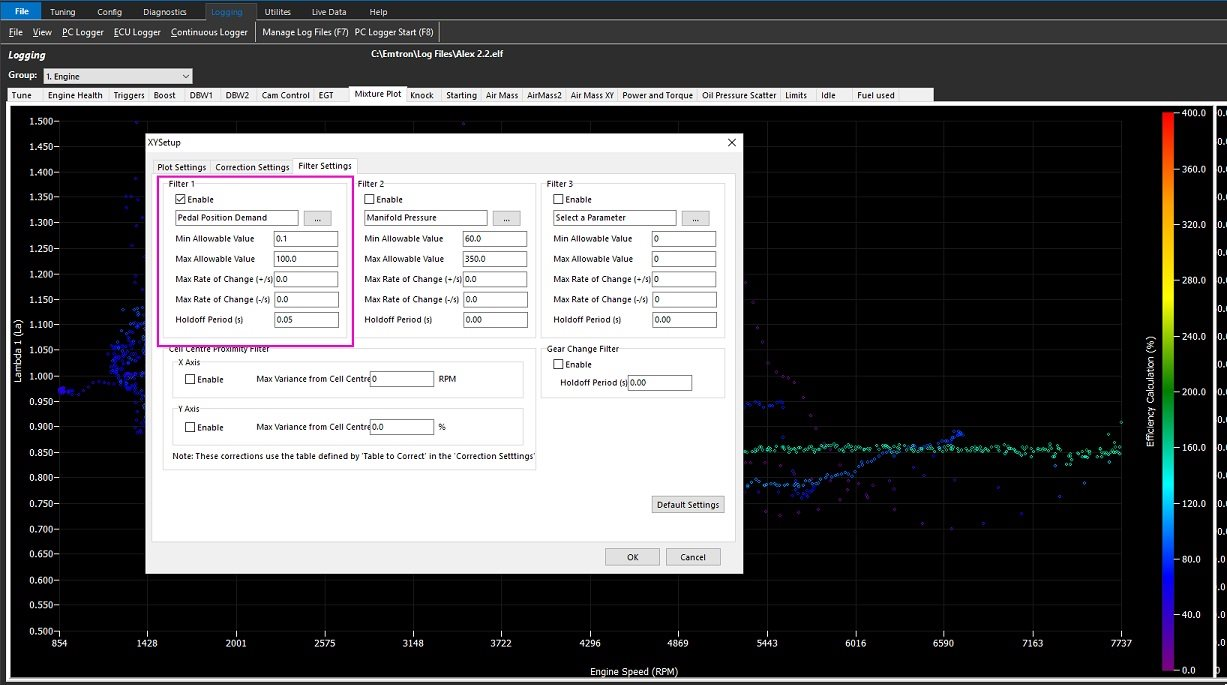
Set appropriate filters as required
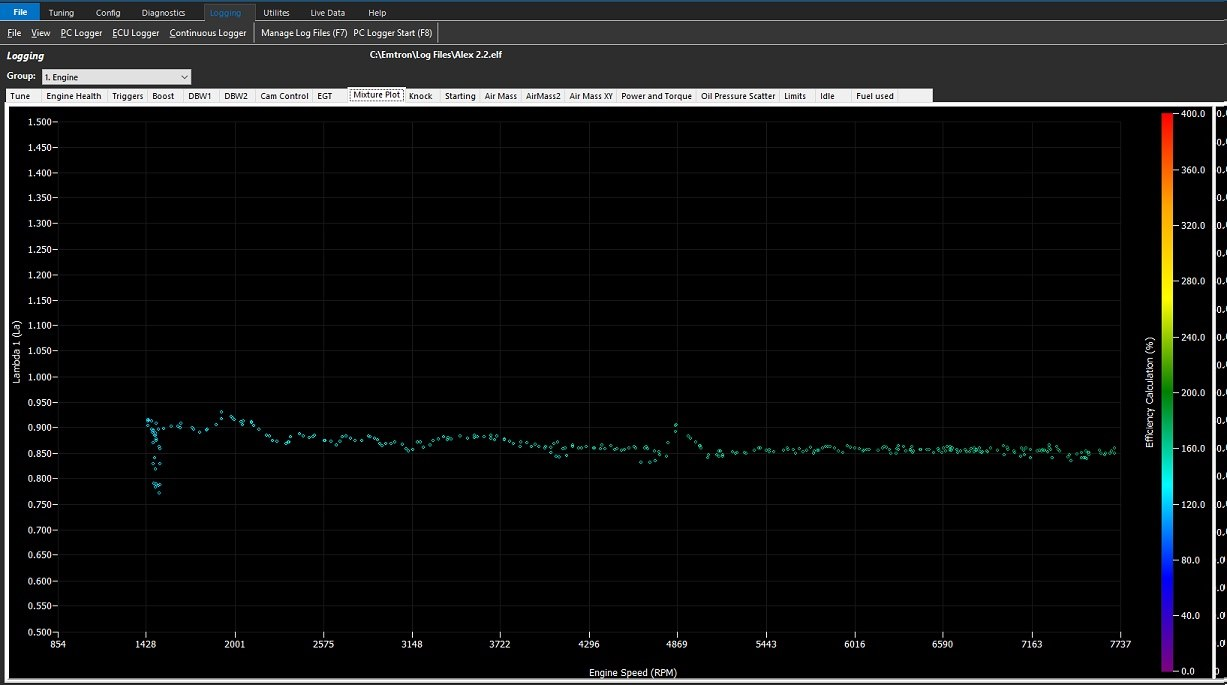
Return to the filtered scatter plot
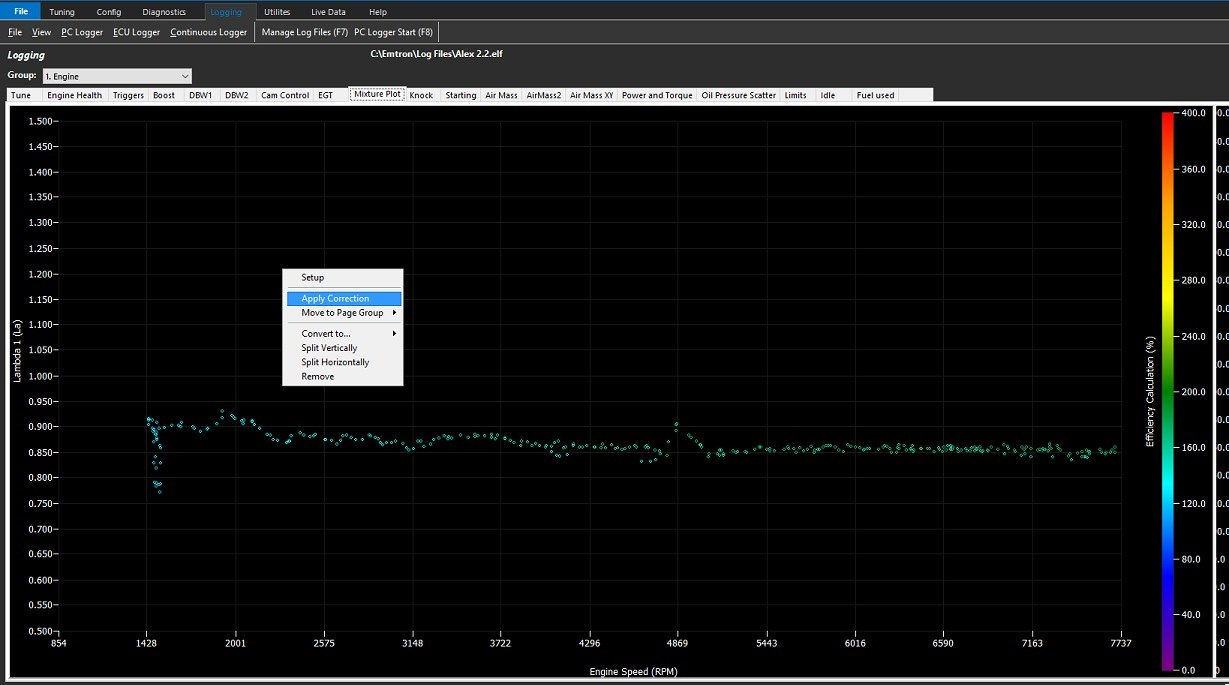
Apply the correction
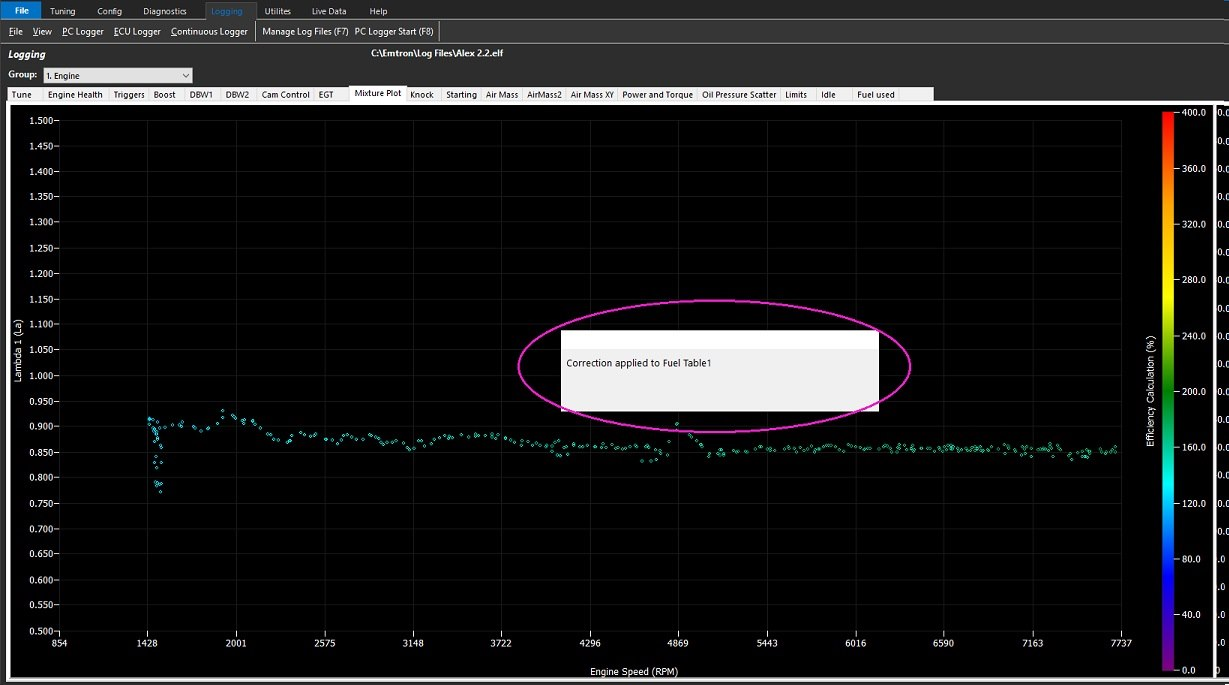
Emtune with acknowledge when this is complete